International Journal of Theoretical and Applied Nanotechnology (IJTAN)
ISSN: 1929-1248

Volume 9 - Year 2021 - Pages 01-07
DOI: 10.11159/ijtan.2021.001
Effects of Hydrogen Concentration and Cooling Speed on Fabrication of Hydrogenated Amorphous Silicon: Quantum Simulation
Haili Li1, Mitsuhiro Matsumoto1
1Graduate School of Engineering, Kyoto University
Kyoto-daigaku-Katsura, Kyoto 615-8540, Japan
li.haili.75x@st.kyoto-u.ac.jp; matsumoto@kues.kyoto-u.ac.jp
Abstract - In order to investigate various properties of hydrogenated amorphous silicon (a-Si:H) for improvement of low conversion efficiency and stability of solar cells, a series of quantum simulations based on the density functional theory combined with the tight binding model were performed for a-Si:H with various hydrogen concentrations and cooling rates. The radial distribution function (RDF) for Si-Si pairs indicates that samples with higher H concentration (20% and 25%) give a structure in better agreement with experiments, but the RDF of Si-H pairs suggests that samples with lower H concentration (14%) may give more appropriate structure. The coordination number (Nc) analysis indicates that more defects (dangling bonds and floating bonds) exist in 20% and 25% H concentration samples. Overall, a-Si:H with 14% H concentration gives most preferable structure. The cooling rate has also much effect on the structure. Sample with the slowest cooling rate is slightly more structured based on Si-Si pair RDF and Nc. The electron transport of a-Si and a-Si:H were evaluated and the superiority of a-Si:H was confirmed.
Keywords: Hydrogenated amorphous silicon, structural analysis, electronic property, electronic transport, solar cell, quantum simulation.
© Copyright 2021 Authors - This is an Open Access article published under the Creative Commons Attribution License terms. Unrestricted use, distribution, and reproduction in any medium are permitted, provided the original work is properly cited.
Date Received: 2020-12-20
Date Accepted: 2020-12-22
Date Published:2021-02-17
1. Introduction
Hydrogenated amorphous silicon (a-Si:H) is a low-cost and excellent light-absorbing material and has attracted much attention in the field of thin-film solar cells since the first report by Carlson et al. in 1976 [1]. It still has shortcomings, however, such as low efficiency of photo-conversion and light-induced degradation (Staebler-Wronski effect) [2]-[3], limiting its application in wide fields. In order to improve its total performance, further research is still needed on microscopic structure and basic performance. The disorder in the microstructure of hydrogenated amorphous silicon has led to the complexity of its structure. In the past 40 years, tremendous amount of experimental and theoretical investigation has been reported. For example, for the role of hydrogen atoms passivating some defect states, Wronski and Collins [4] reported single-cell nano-amorphous silicon thin film solar cells with a stable conversion rate of 9-10% under high hydrogen dilution ratio conditions. More recently Luo et al. adopted molecular dynamics methods to simulate the influence of different substrate temperatures on the structure of a-Si:H [5], showing that the surface roughness of the film decreases with the increase of the substrate temperature. Czaja et al. reported the structure, electronic and optical properties of different sizes of a-Si:H based on a first-principle density functional theory (DFT) [6]. Zhang et al. also executed first-principle DFT calculations to study a network growth in films [7], showing a continuous disorder-order phase transition.
Among various key factors to improve the performance, hydrogen concentration is one of the most relevant ones [8]. It has been shown that the hydrogenation of a-Si has a beneficial effect in reducing the overall strain energy of the a-Si network [9]. Legesse et al. investigated the optical gap and the electron mobility with VASP [10] and proposed three regimes of the hydrogen concentration; in the unsaturated regime, both the optical gap and the mobility increase with the increase of hydrogen concentration until they converge to some constant values in the saturated regime. Ukpong et al. also found with tight-binding (TB) quantum simulations [11] that the local order and the intrinsic stress are much affected by the hydrogen concentration, suggesting the existence of optimal concentration. In the fabrication of a-Si:H through quenching the melt silicon, the annealing rate is of course another relevant factor. Many studies have shown that a-Si samples for practical use can be obtained by annealing, but their electronic properties strongly depend on the cooling rate. Jarolimek et al. [12] conducted a first-principles molecular-dynamics simulations study using VASP, showing that the cooling rate of 0.138 K/fs = 1.38 × 10¹⁴ K/s is slow enough to obtain low defect concentration samples with realistic amorphous structures. Santos et al. [13] also studied larger atomic systems with a wider range of cooling rate (from 3.3 × 10¹⁰ to 8.5 × 10¹⁴ K/s), indicating that samples prepared with cooling rate below 1011 K/s have similar structural parameters to experiments. Recent machine learning-driven molecular dynamics simulations also give similar results [14].
As for the stability of a-Si:H, the Staebler-Wronski effects are still problematic [15, 16]. Another perspective to be considered is the low values of electron transport in amorphous materials. Liu et al. examined the electron transport of a single silicon atom or atomic chain sandwiched between Au electrodes, which is the elementary part of the nanoscale junctions [17, 18].
In order, to look into the atomic scale structures and electronic properties of a-Si:H depending on various factors, we have carried out quantum molecular simulations. In this paper, we report the effects of the two relevant factors, i.e., the hydrogen contents and the cooling rates.
2. Methods
We investigated the silicon-hydrogen systems based on the density functional (DF) theory with the tight binding (TB) model, by utilizing the DFTB+ package [19] with the matsci-0-3 parameter set [20].
2.1 Sample preparation
To generate the atomic configuration of a-Si:H at a given hydrogen concentration, we employed the heat-and-quench method similar to Ref. [21]. First, a cubic super-cell of Si crystal with 64 atoms in 10.862 Å × 10.862 Å × 10.862 Å is prepared and a given number of randomly selected Si atoms are replaced by H atoms. The system is heated well above the melting temperature (about 2370 K) with a temperature controlled molecular dynamics (MD) simulation. After keeping the high temperature for 3ps, the melt sample is cooled down to 300 K with a given cooling rate. A typical configuration of obtaind a-Si:H is shown in Fig. 1. The periodic boundary conditions are assumed for all directions. For the electronic energy evaluation, we use a 2×2×2 Monkhorst-Pack mesh for the Brillouin zone sampling. The time step the MD simulation is 1.0 fs.
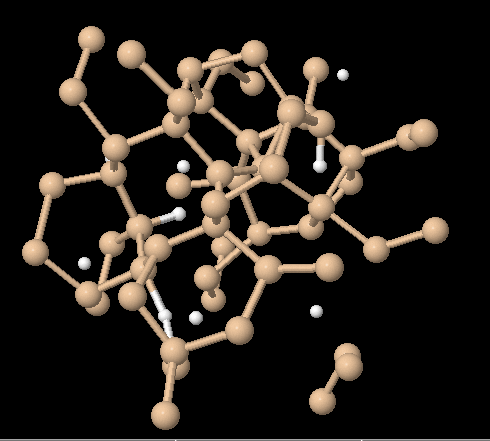
Table 1. Simulation conditions.
| Name | Number of atoms | |
| Si | H | |
| 0%H | 64 | 0 |
| 8%H | 59 | 5 |
| 11%H | 57 | 7 |
| 14%H | 55 | 9 |
| 17%H | 53 | 11 |
| 20%H | 51 | 13 |
| 25%H | 48 | 16 |
| Name | Cooling rate | |
| K/fs | K/s | |
| v1 | 2.07 | 2070 × 1012 |
| v2 | 1.035 | 1035 × 1012 |
| v3 | 0.414 | 414 × 1012 |
| v4 | 0.1035 | 103.5 × 10¹² |
| v5 | 0.05175 | 51.75 × 10¹² |
We investigated the cases with six different H concentrations and five cooling rates as shown in Table 1.
2.2 Electron transport properties
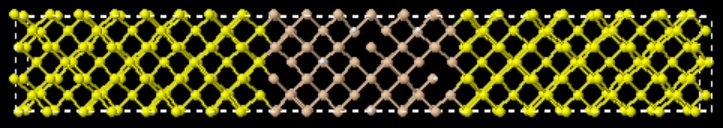
We have investigated the electron transport properties of a-Si:H and a-Si samples using the DFTB+ package with the non-equilibrium Green’s function (NEGF). For that purpose, the target sample should be sandwiched between two “electrodes”. In this paper, we adopted crystalline silicon (c-Si) or a-Si as the electrode. Typical configuration for the electron transport calculation is shown in Fig. 2. The 5×5×1k-point sampling was used.
3. Results and Discussion
3.1. Influence of Hydrogen Concentration
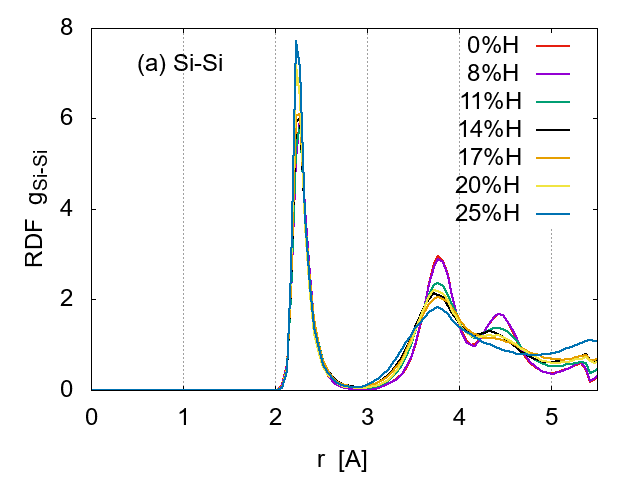
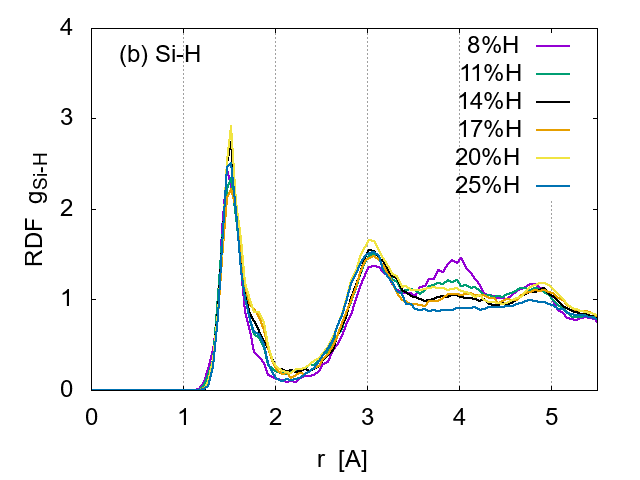
First, we examined how the hydrogen concentration affects the structure,
under v3 (medium cooling speed) conditions. The radial distribution
functions (RDF) were calculated to examine the sample structure, as shown
in Fig. 3. The shape of
![]() for Si-Si pairs shows a typical amorphous character for all H
concentrations. As the H concentration increases, the local order indicated
by the first peak becomes more apparent, but the second and the third peaks
gradually diminish, suggesting that the mid-range order is weakened by the
H increase. The dependence is not apparent in
for Si-Si pairs shows a typical amorphous character for all H
concentrations. As the H concentration increases, the local order indicated
by the first peak becomes more apparent, but the second and the third peaks
gradually diminish, suggesting that the mid-range order is weakened by the
H increase. The dependence is not apparent in
![]() for Si-H pairs.
for Si-H pairs.
The distance between the nearest Si-Si pairs is 2.2- 2.3 A, while that for the second neighbours is 3.7-3.8 A, in good agreement with previous reports [7]. These distances are little affected by the H concentration, indicating that the basic Si network remains intact.
The atomic coordination number, i.e., the number of nearest neighbours around a Si atom, is evaluated. As shown in Table 2, the perfect four coordination (Si4) dominates of course, followed by Si3 and Si2. The average coordination number Nc is about 3.8, and the concentration dependence is not apparent. The largest Nc is obtained for the 14% concentration sample, which is close to an experimental value 3.88 [22]. One possible reason for the large Nc is the existence of “floating bonds” indicated by Si5. The Nc of all cases are less than 4, which implies that three coordinate atoms (i.e., dangling bond state) are dominant in a-Si:H, in good agreement with experiments and other simulations [21].
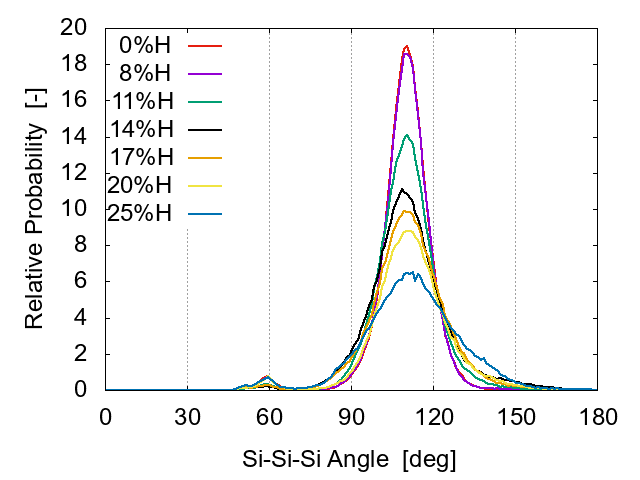
Table 2. Ratio of atomic coordinations and the mean coordination number for a-Si:H with v3 cooling.
| Hydrogen concentration | ||||||||
| 0%H | 8%H | 11%H | 14%H | 17%H | 20%H | 25%H | ||
| Type of coordination | Si5 | 0.4% | 0.3% | 0.5% | 2.6% | 2.2% | 0.4% | 1.8% |
| Si4 | 78.6% | 77.6% | 70.5% | 64.8% | 58.8% | 45.4% | 45.9% | |
| Si3 | 20.9% | 13% | 14.1% | 12.5% | 14.9% | 24.2% | 21.7% | |
| Si2 | 0.1% | 0.1% | 1.0% | 1.0% | 1.2% | 0.5% | 0.6% | |
| Si4H | 0.1% | 0.3% | 0.9% | 0.4% | 1.0% | 1.0% | ||
| Si3H | 8.8% | 12.9% | 16.9% | 19.2% | 25.1% | 26.7% | ||
| Si2H | 0.1% | 0.4% | 1.2% | 2.5% | 2.6% | 1.6% | ||
| Si*H2 | 0.1% | 0.1% | 0.6% | 0.8% | 0.6% | |||
| Mean coordination number Nc | 3.793 | 3.871 | 3.834 | 3.877 | 3.814 | 3.728 | 3.773 | |
The distribution of the Si-Si-Si bond angle is shown in Fig. 4. The peak exists at 109.5° for all cases. Note that all cases have a peak around 60°. This is similar to the 55° peak in Jarolimek's report [12], where the peak is assigned to metallic bonding. Štich et al. [23] also showed a similar peak around 60°, which is argued to indicate the existence of coordination defects.
As the H concentration increases, the main peak at 109.5° becomes suppressed and broadened, while the second peak around 60° is diminished. When the H concentration is greater than 17%, the second peak becomes larger again, suggesting more defects.
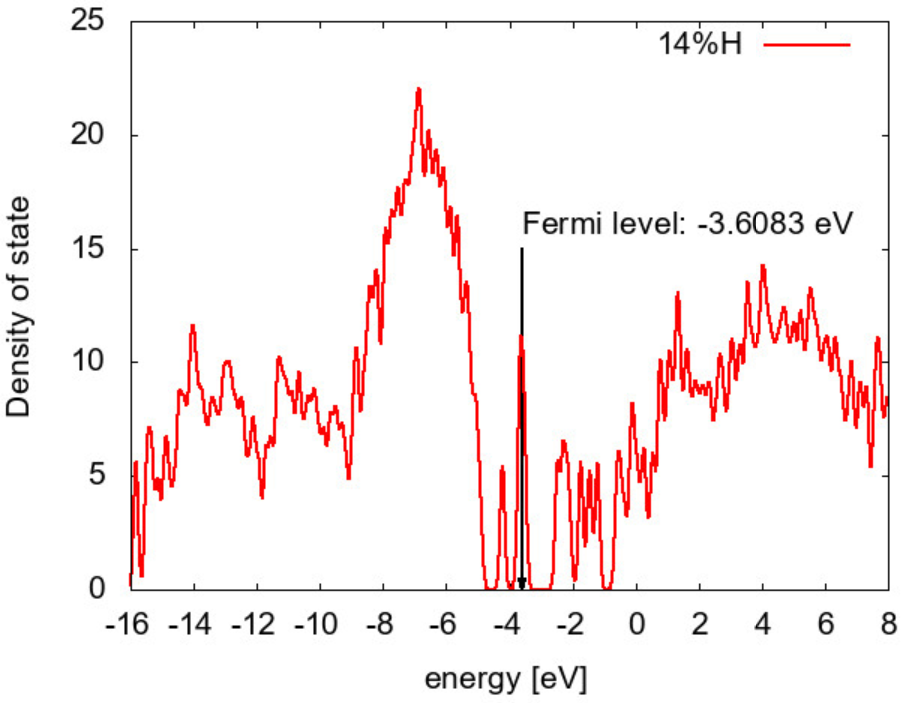
The electronic state analysis was done to obtain the density of states (DOS). An example is shown in Fig. 5 for the 14%H sample with v3 cooling condition. There exist two apparent groups of defect states in the band gap (-4.6 eV < E < -2.8 eV ). Although strict assignment is not possible yet, these should correspond to the states of dangling and floating bonds according to the ratio of atomic coordination in Table 2.
3.2. Influence of Cooling Rate
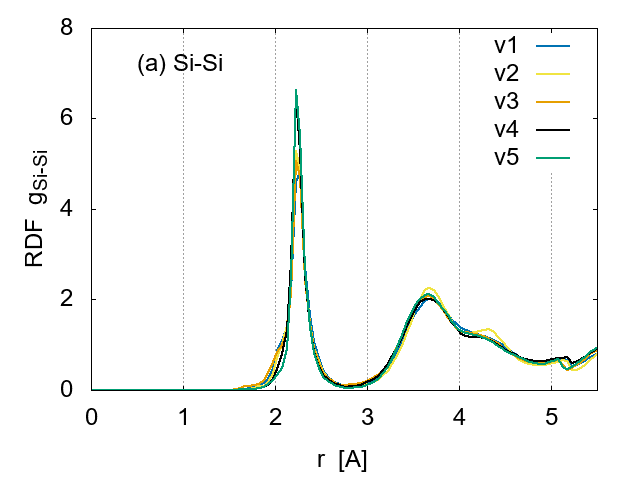
To investigate the effect of cooling rates on the sample structure, the RDFs are compared in Fig. 6 for the same H concentration (14 %). Although the apparent structure is very similar for Si-Si pairs, the height of peaks indicates that the ordering is more developed for the slowest cooling samples (v5:0.05175 K/fs), as expected.
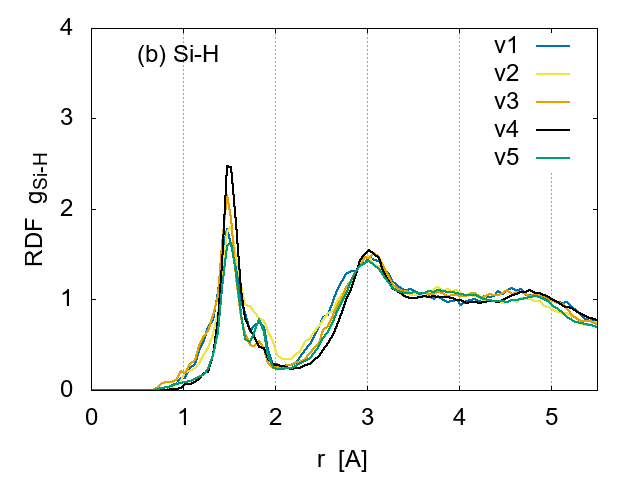
The cooling rate seems to affect the Si-H pair correlation, as shown in Fig. 6 (b). An extra peak appears around 1.8 A for the fastest cooling case v1 and the slowest v5, suggesting a creation of weak bonds between Si and H or recombination of H atoms to form molecular hydrogen. Thus the extremely slow cooling for the simulation is not preferred.
Table 3. Ratio of atomic coordinations and the mean coordination number for 14%H a-Si:H.
| Cooling speed condition | ||||||
| v1 | v2 | v3 | v4 | v5 | ||
| Type of coordination | Si5 | 17.9% | 17.5% | 12.2% | 10.3% | 8.7% |
| Si4 | 51.1% | 51.3% | 58.8% | 63.6% | 68.5% | |
| Si3 | 3.1% | 2.6% | 4.3% | 2.0% | 0.6% | |
| Si2 | 0.1% | 0.1% | 0.1% | 0% | 0% | |
| Si4H | 6.6% | 5.8% | 4.8% | 6.8% | 8.5% | |
| Si3H | 9.5% | 10.9% | 10.2% | 7.4% | 3.1% | |
| Si2H | 0.4% | 0.4% | 0.4% | 0.1% | 0% | |
| Si*H2 | 1.1% | 2.0% | 2.2% | 2.3% | 3.4% | |
| Mean coordination number Nc | 3.789 | 3.805 | 3.819 | 3.827 | 3.844 | |
The atomic coordination is examined, as shown in Table 3. The average coordination number Nc is again about 3.8, but the cooling rate dependence is apparent. As the cooling rate decreases the coordination number gradually increases, mainly due to the increase of four-coordination atoms (Si4), suggesting more ordered structure.
The angular distribution for Si-Si-Si is shown in Fig. 7. The main peak exists at 109.5°, and the small second peak around 50-60°disappears as the cooling rate decreases., suggesting that the number of defects decreases.
3.3 Electronic transport
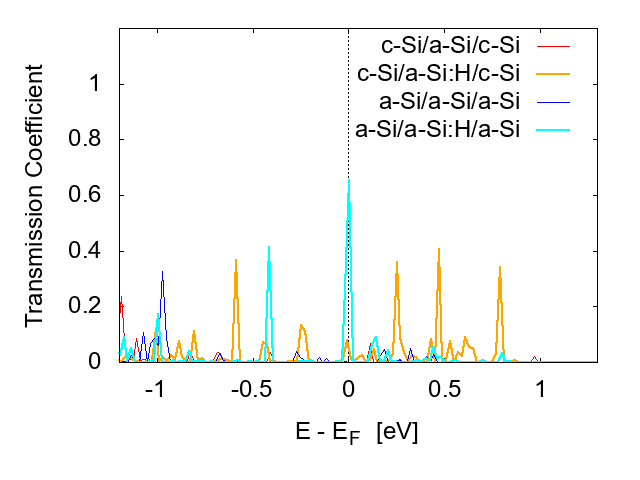
The energy-dependent transmission coefficient T(E) represents the electron transport behavior. Four systems (Table 4) are examined.
The results are shown in Fig. 8, where T(E) around the Fermi level ϵF is compared, because the transmission around ϵF determines the transport properties of devices in equilibrium [24]. Comparison of the four systems indicates that the hydrogenation of a-Si drastically improves the transmission near ϵF, suggesting the passivation of defects by hydrogen.
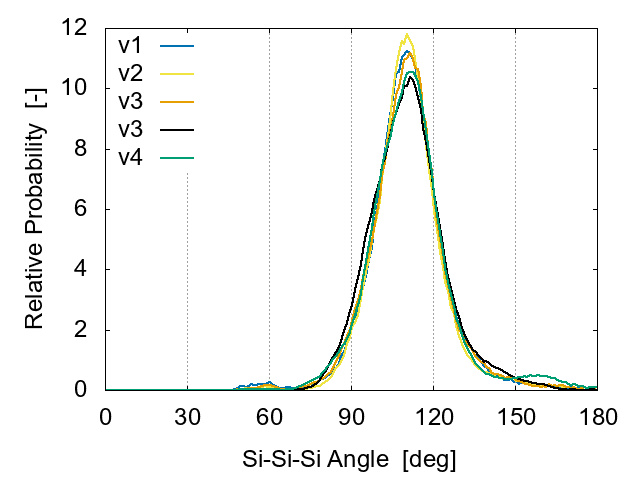
Table 4. System for transport investigation.
| Target | Electrodes | |
| c-Si/a-Si/c-Si | a-Si | crystalline Si |
| c-Si/a-Si:H/c-Si | a-Si:H | crystalline Si |
| a-Si/a-Si/a-Si | a-Si | a-Si |
| a-Si/a-Si:H/a-Si | a-Si:H | a-Si |
4. Conclusion
We investigated the structure and the electronic properties of hydrogenated amorphous silicon with a quantum simulation based on the DFTB scheme, focusing on the effects of the hydrogen concentration and the cooling rate. The radial distribution function and the coordination number analysis indicate that the hydrogen concentration strongly affects the structure. The sample with 14 % H concentration has a largest coordination number, probably caused by the balance between the numbers of the dangling bonds and the floating bonds. The cooling rate has also much effect on the structure; the sample with the slowest cooling rate is more structured, but extra correlation of Si-H appears, suggesting generation of molecular state of hydrogen. The electron transmission coefficient also suggests that passivation of defects by hydrogen atoms leads to much improvement of electron transport.
Since it is confirmed that the role of hydrogen in amorphous silicon is well investigated with this model, we are planning to examine the destabilization mechanism (Staebler-Wronski effect), transport behaviour through various boundaries, and the structural change in doped materials.
References
[1] D. E. Carlson and C. R. Wronski, “Amorphous silicon solor cell,” Applied physic Letters, vol. 28, no. 11, pp. 671-673, 1976. View Article
[2] R. A. Street, Hydrogenated amorphous silicon, Cambridge Univ. Press, 1991. View Article
[3] D. L. Staebler and C. R. Wronski, “Reversible conductivity changes in discharge‐produced amorphous Si,” Appl. Phys. Lett., vol. 31, no. 4, pp. 292-294, 1977. View Article
[4] C. R. Wronski and R. W. Collins, “Phase engineering of a-Si:H solar cells for optimized performance,” Solar Energy, vol. 77, pp. 877-885, 2004. View Article
[5] Y. Luo, H. Gong, N. Zhou, H. Huang and L. Zhou, “Molecular dynamics study about the effect of substrate temperature on a-Si:H structure,” Appl. Phys. A, vol. 124, no. 18, pp. 1-9, 2018. View Article
[6] P. Czaja, M. Celino, S. Giusepponi, M. Gusso, and U. Aeberhard, “Ab initio study on localization and finite size effects in the structural, electronic, and optical properties of hydrogenated amorphous silicon,” Comput. Mater. Sci., vol. 155, pp. 159–168, 2018. View Article
[7] Y. Zhang, H. Wang, Y. Gou, and S. Jiang, “Evolution of medium-range order and surface compositions by mechanism driven model with realistic network,” Appl. Surf. Sci., vol. 464, pp. 321–327, 2019. View Article
[8] C. Maurer, S. Haas, W. Beyer, F. C. Maier, U. Zastrow, M. Hülsbeck, U. Breuer and U. Rau, “Application of Raman spectroscopy for depth-dependent evaluation of the hydrogen concentration of amorphous silicon,” Thin Solid Films, vol. 653, pp. 223–228, 2018. View Article
[9] R. V. Meidanshahi, S. Bowden and S. M. Goodnick, “Electronic structure and localized states in amorphous Si and hydrogenated amorphous Si,” Phys. Chem. Chem. Phys., vol. 21, pp. 13248—13257, 2019. View Article
[10] M. Legesse, M. Nolan and G. Fagas, “Revisiting the dependence of the optical and mobility gaps of hydrogenated Amorphous Silicon on Hydrogen Concentration,” J. Phys. Chem. C, vol. 117, pp. 23956−23963, 2013. View Article
[11] A. M. Ukpong, M. Harting and D. T. Britton, “Theoretical study of strain fields and local order in hydrogenated amorphous silicon,” Phil. Mag. Lett., vol. 88, no. 4, pp. 293–302, 2008. View Article
[12] K. Jarolimek, R. A. de Groot, G. A. de Wijs and M. Zeman. “First-principles study of hydrogenated amorphous silicon,” Phys. Rev. B, vol. 79, p. 155206, 2009.View Article
[13] I. Santos, M. Aboy, L. A. Marqués, P. López, L. Pelaz. “Generation of amorphous Si structurally compatible with experimental samples through the quenching process: A systematic molecular dynamics simulation study,” J. Non-Cryst. Solids, vols. 503–504, pp. 20–27, 2019. View Article
[14] V.L. Deringer, N. Bernstein, A.P. Bartok, M.J. Cliffe, R.N. Kerber, L.E. Marbella, C.P. Grey, S.R. Elliott, G. Csanyi,. “Realistic atomistic structure of amorphous silicon from machine learning-driven molecular dynamics,” Phys. Chem. Lett., vol. 9, pp. 2879-2885, 2018. View Article
[15] S. C. Agarwal and S. Omar, “Forty years of the Staebler–Wronski effect,” Phil. Mag., vol. 98, no. 27, pp. 2512–2528, 2018. View Article
[16] S.C. Agarwal, “Role of heterogeneities in Staebler-Wronski effect,” Phil. Mag., vol. 93, pp. 1-14, 2012. View Article
[17] F. T. Liu, Y. Cheng, F. B. Yang and X. R. Chen, “Effects of contact geometry on the transport properties of a silicon atom,” Chinese Phys. Lett., , vol. 30, no. 10, p. 107303, 2013. View Article
[18] F. T. Liu, Y. Cheng, F. B. Yang, and X. R. Chen, “Electron transport through a silicon atomic chain,” Chinese Phys. Lett., vol. 30, p. 067302, 2013. View Article
[19] https://www.dftbplus.org/ View Article
[20] https://www.dftb.org/parameters/ View Article
[21] N. C. Cooper, C. M. Goringe, D. R. McKenzie, “Density functional theory modelling of amorphous silicon,” Comp. Mat. Sci., vol. 17, pp. 1–6, 2000. View Article
[22] K. Laaziri, S. Kycia, S. Roorda, M. Chicoine, J. L. Robertson, J. Wang, and S. C. Moss, “High energy X-ray diffraction study of pure amorphous silicon,” Phys. Rev.B., vol. 60, no. 19, pp. 13520−13533, 1999. View Article
[23] I. Stich, R. Car, M. Parrinello, “Amorphous silicon studied by ab initio molecular dynamics: Preparation, structure, and properties,” Phys. Rev. B, vol. 44, no. 20, pp.92-104, 1991. View Article
[24] X. Q. Zhang, H. Li, K. M. Liew, “The structures and electrical transport properties of germanium nanowires encapsulated in carbon nanotubes,” J. Appl. Phys., vol. 102, 073709, 2007. View Article