International Journal of Theoretical and Applied Nanotechnology (IJTAN)
ISSN: 1929-1248

Volume 6 - Year 2018 - Pages 11-20
DOI: 10.11159/ijtan.2018.003
Effects of Size and Morphology of TiO2 and SiO2 Airborne Nanoparticles on their Filtration through Chemical Protective Clothing
Ludwig Vinches and Stéphane Hallé
École de technologie supérieure, Department of Mechanical Engineering
1100 Notre-Dame Street West, Montreal, Quebec, Canada H3C 1K3
cc-ludwig.vinches@etsmtl.ca; stephane.halle@etsmtl.ca
Abstract - Titanium dioxide (nTiO2) and silicon dioxide (nSiO2)
nanoparticles are employed in numerous products that are
used daily and also in building materials such as concrete,
plaster or paints. Whether during manufacturing or released
by sanding or polishing, nTiO2 and nSiO2 can become airborne,
exposing workers to possible health risks. Although the
penetration of airborne nanoparticles through the filtering
media used in respiratory protective equipment has been
studied for several years with different types of airborne
nanoparticles, the study of the efficiency of chemical protective
clothing (CPC) materials is much more recent. Furthermore,
these studies were generally conducted with polydisperse
sodium chloride airborne nanoparticles, which are particles
that are seldom used in the workplace.
The present work focuses on the effect of the size and shape of
nTiO2 and nSiO2 airborne nanoparticles on their penetration
level through a sample of filtering material directly taken from
a model of nonwoven CPC. The clogging effect was also
evaluated and its impact on the pressure drop was determined.
Results indicate that contrary to the particle size, the shape
could have a significant effect on the level of penetration.
Moreover, clogging due to the deposit of nanoparticles on the
filtering fibers could be seen, in some cases, in terms of
penetration, but did not have a significant effect on the
pressure drop.
Keywords: nTiO2 and nSiO2 Airborne Nanoparticles, Aerosol Filtration, Chemical Protective Clothing, Clogging Effect, Pressure Drop.
© Copyright 2018 Authors - This is an Open Access article published under the Creative Commons Attribution License terms. Unrestricted use, distribution, and reproduction in any medium are permitted, provided the original work is properly cited.
Date Received: 2018-02-05
Date Accepted: 2018-05-01
Date Published: 2018-05-31
1. Introduction
Titanium dioxide (nTiO2) and silicon dioxide (nSiO2) nanoparticles are used in numerous products for their specific physical and chemical properties. For example, nTiO2 are added to sunscreens to enhance their UV-blocking properties and also to facilitate their penetration through the skin or to paints to increase their penetration through a treated surface [1]. nTiO2 are also employed in the agro-food industry as a white colorant in ice-creams, flours or yogurts. As for nSiO2, it is used as an additive for rubber and plastics, as strengthening filler for concrete and other construction composites or also as a platform for biomedical applications, such as drug delivery. In 2010, 50,400 tons of TiO2 was produced, 0.7% of which was nTiO2 [2]. Based on this same report, production of nTiO2 is projected to increase to 12% between 2014-2019.
Consequently, given the growing interest of manufacturers for these engineered nanomaterials (ENMs), workers are increasingly exposed to them. By 2018-2020, the number of workers in contact with ENMs worldwide is estimated to reach more than 6 million [3], even though in 2010, the International Agency for Research on Cancer classified nanosized titanium dioxide in the 2B-group as possibly carcinogenic to humans [4]. This decision followed numerous studies that caution about its likely harmful effects on health. Other studies have also reported the toxicity of nSiO2 [5]-[7]. Although inhalation is the most direct exposure pathway of airborne ENMs, dermal contact is also significant. A study conducted on hairless mice and porcine skin, after subchronic dermal exposure to nTiO2, showed that the ENMs can be located in the deep layers of the epidermis [8]. After 60 days of dermal exposure, nTiO2 reaches different tissues and pathological lesions can be observed. Other studies indicated the penetration of engineered nanoparticles (ENP) through intact or damaged human skin [9]-[12]. Based on these findings, workers must be sure to wear highly effective chemical protective clothing (CPC).
Numerous works have been published on the efficiency of filtering media against submicronic and nanoscale particles, but most of these works analyzed the materials used in respiratory protective equipment, such as the screens, used as standard models to develop filtration models [13]-[18]. Almost all of these studies were performed with polydisperse aerosols regardless of the effect of the size and morphology of the ENMs. Only a few were interested in the effectiveness of nonwoven CPCs and in particular, against different types of airborne nanoparticles [19]-[21], but in laboratory conditions and not in workplace conditions. In 2016, Ben Salah et al. published results on the efficiency of four nonwoven CPC materials against polydisperse sodium chloride nano and submicron airborne particles while applying mechanical deformation to the CPC material to simulate occupational use [22]. Three nonwoven fabrics had efficiencies above 99% and one around 91.5%. Recently, Vinches et al. conducted a complementary study to that of Ben Salah et al. by evaluating the effectiveness of the seams and zippers for the same models of CPCs [23].
Most studies on filtration were performed with spherical particles. However, numerous aerosol particles differ in structural properties such as shape and size, or even present an agglomerate structure. Recently, some studies focused on the effect of these structural properties on the filtration efficiency, but only with the screen or fibrous filters that are used as standard filters in respiratory protective devices. Kim et al. (2009) investigated the effect of silver particle agglomeration (50 and 200 nm) through a fiberglass HEPA filter (solidity 0.050 and a face velocity at 5.3 cm/s) [24]. The authors concluded that the filter had a better efficiency against agglomerate particles than with spherical particles having the same mobility diameters. Wang (2013) modeled the filter efficiency of a stainless-steel screen and a HEPA filter exposed to spherical nanoparticles and agglomerates of sodium chloride airborne particles (typically ranging in size from 15 nm to several hundred nanometers) [25]. Moreover, he systematically investigated the filtration velocity, filter fiber size, solidity and thickness. He concluded that the filtration efficiency is higher for agglomerates than for spheres. On the other hand, Chang and Zhou (2017) evaluated and modeled the effect of size and shape of 25 nm-TiO2 nanoparticles on the filtration through a screen filter (solidity 0.345 and face velocities at 2.92 and 5.85 cm/s) [26]. Their conclusion confirmed Kim’s work. The agglomerates produced during aerosol generation penetrated less than single particles. Moreover, their model of filtration verified that the main mechanisms of filtration for this size of particles were diffusion and interception. The diffusion mechanism is caused by Brownian diffusion of aerosol particles and their random collisions with the fiber surface out of flow lines at their path. The interception results in the capture of all particles moving along the flow lines, with the radius more than the distance of these lines from the fiber surface.
Some works have also been published about the clogging effect [27], [28]. Thomas et al. (2001) employed a submicronic soda fluorescein aerosol (150 and 400 nm). The medium studied was HEPA glass fiber filters (solidity 0.094 and 0.056 and face velocities from 1 to 50 cm/s). The authors deduced that the speed of formation of clogging was linked, among others factors, to the face velocity. Moreover, they affirmed that the larger particles entailed a smaller pressure drop.
Based on these findings and to the best of our knowledge, no work has established the effect of the size and shape of airborne nanoparticles commonly encountered in the workplace on the efficiency of CPC materials, such as fibrous nonwoven media. To solve this problematic, this paper aims to provide an experimental understanding of the filtration processes through nonwoven CPC material exposed to airborne nanoparticles of different sizes and shapes. The current authors measured the penetration of nTiO2 and nSiO2 through one type of type-5 CPC material as a function of their size and morphology. The effect of size was determined with 30 and 300 nm nSiO2 and the effect of morphology with 30-50 nm anatase and rutile nTiO2.
2. Materials and Methods
Two types of nSiO2 nanopowder dispersions in water were used. The first, from US Research Nanomaterials, Inc., (Houston, TX,) had an average particle size of 30 nm and was labelled as 25 wt%. The second, from Nanocomposix (NanoXact grade, San Diego, CA) was 300 nm in particle diameter and had a concentration of 10 mg/mL. Concerning nTiO2, two nanopowder dispersions in water were also employed from US Research Nanomaterials, Inc. One was anatase form dispersion (15 wt%) and the other was rutile form dispersion (20 wt%). Both had a 30-50 nm size range in particle diameter. The stability of the suspension is guaranteed by the supplier for 6 months and all suspensions are stored at 4°C, away from light.
For each kind of nanoparticle dispersion, the commercial suspensions were not used directly. Dilutions in MilliQ water (18.2 MΩ cm at 25°C, Organic Carbon < 2 µg C·L-1) were performed to obtain concentrations of 200 ppm. These new dispersions were also stored at 4°C, away from light, but not more than 48 hours. Before the dilutions, the nanoparticle dispersions were sonicated for at least 15 minutes (80 kHz, FB11207, Fisherbrand).
Airborne wet particles of these different suspensions were generated using a nebulizer (Collison 3 jets, BGI by Mesa Labs, Colorado, USA). Dry, clean compressed air at 0.69 bar (10 psig) was employed for the nebulizer.
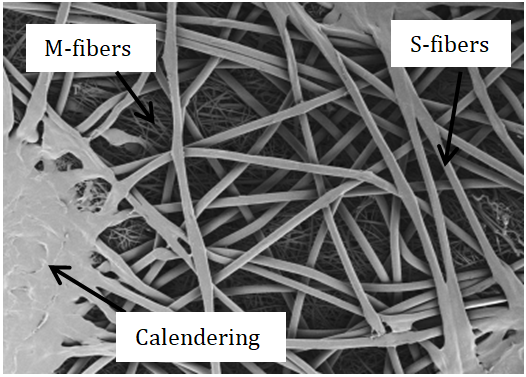
The CPC material samples studied are taken from nonwoven type-5 protective suits, thus they must offer good resistance to solid airborne particles. The structure of the material consists of three internal layers, called M, to absorb possible filtration and two external layers, called S, to enclose the M-layers and maintain the global structure of the material. The five layers are made of polypropylene. The structure of the CPC materials was analysed using scanning electron microscopy (SEM, Hitachi S3600N – Vacc = 5 kV – magnification × 100). The sample was covered with a gold film (15 nm) to ensure its metallization.
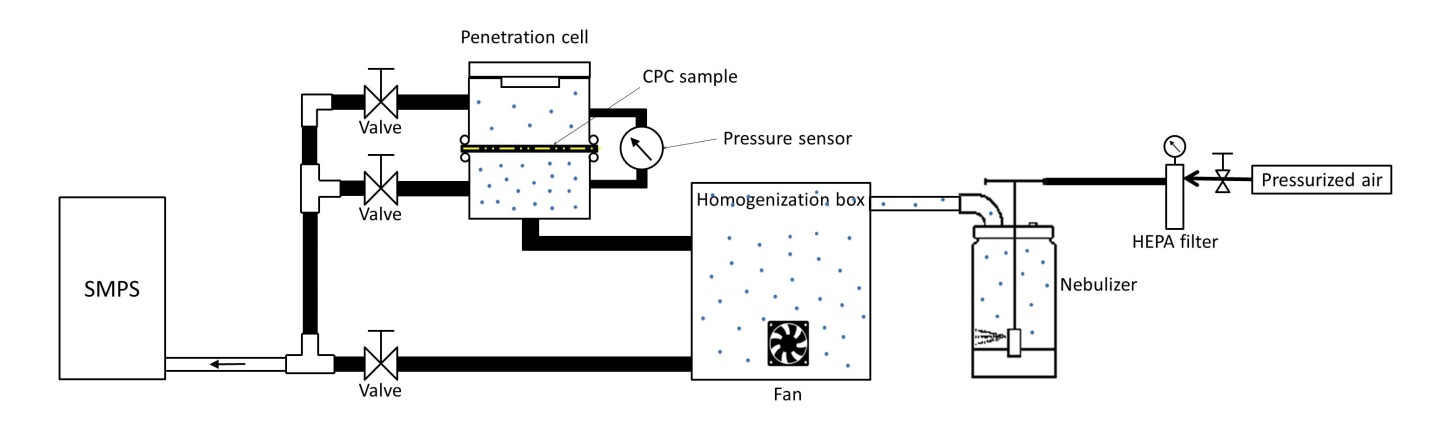
A test bench was designed to measure the penetration of airborne nSiO2 or nTiO2 particles through CPC material samples (Figure 1). The experimental setup and strategy are almost the same as those presented by Vinches and Hallé [23]. The only difference was that unlike Vinches and Hallé (2017), the p-Trak was replaced by a Scanning Mobility Particle Sizer (SMPS) - SMPS Platform 3936 (TSI Inc., Shoreview, MN; with DMA 3081, CPC 3775, Neutralizer 3077). Sample and sheath flow rates were maintained at 0.6 and 6 Lpm (liters per minute) corresponding to a face velocity equal to 0.435 cm/s. The face velocity was calculated dividing the aerosol flow rate (0.6 L/min) by sample area (23 cm2). A 0.046 cm impactor was fitted for the nTiO2 and 30 nm-nSiO2 airborne particles and a 0.071 cm impactor for 300 nm-nSiO2.
The experimental penetration, P, of airborne particles through the CPC was defined as follows:
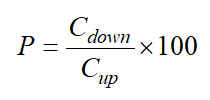
where Cdown was the downstream concentration and Cup the upstream concentration.
Only after the system equilibrium conditions (i.e. size distribution and concentration particles) were reached, within 5 min., could data begin to be collected. Different durations of exposure were determined arbitrarily (at the beginning of the test (0 h, 1 h, 2 h), without ever exceeding the maximum wearing time of CPC, estimated to be 3 hours. To ensure statistically significant results, all the tests were replicated five times and the measurements were recorded as mean (M) ± Standard Deviation (SD).
To evaluate the pressure drop,ΔP, a pressure sensor (Figure 1) was connected between the two chambers and the pressure drop was calculated according to Eq. 2:
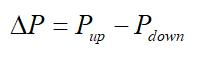
where Pup was the upstream pressure and Pdown the downstream pressure.
As will be addressed in section “CPC material and nanoparticles characterization”, determining the mean fiber diameter was a difficult task using SEM, due for the most part to electrical charges accumulated on the samples. Indeed, not only was SEM not a suitable technique because of this, but also because of the many deformed fibers (crushed or stretched) that result from the manufacturing process. To circumvent this problem, an equivalent diameter, called the Davies diameter, could be calculated using the following equation [29]:
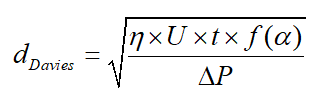
where![]() is an
empirical correlation including non-ideal effects,
is an
empirical correlation including non-ideal effects, ![]() is the
dynamic viscosity of the air (1.81
is the
dynamic viscosity of the air (1.81![]() 10-5 Pa.s at 22°C), U the face velocity
and t the material thickness. The solidity,
10-5 Pa.s at 22°C), U the face velocity
and t the material thickness. The solidity,![]() , defined as (1-porosity), was determined
by mercury intrusion porosimetry (Micromeritics; AutoPore IV 9500). Triplicate
tests were performed. Finally, the thickness was evaluated using standard
CAN/CGSB-4.2 No. 37-2002 [30]. In the end, the Davies diameter was not
necessary for the present work, but it was used to better characterize the
protective clothing material.
, defined as (1-porosity), was determined
by mercury intrusion porosimetry (Micromeritics; AutoPore IV 9500). Triplicate
tests were performed. Finally, the thickness was evaluated using standard
CAN/CGSB-4.2 No. 37-2002 [30]. In the end, the Davies diameter was not
necessary for the present work, but it was used to better characterize the
protective clothing material.
3. Experimental Results
3. 1. Chemical Protective Clothing Material and Nanoparticle Characterization
Two physical parameters (thickness and solidity) of the selected CPC and an evaluation of the Davies diameter are shown in Table 1.
Table 1. Specifications of the selected CPC.
| Physical parameters | (M ± SD) |
| CPC thickness (µm) | 323 ± 3 |
| Solidity | 0.194 ± 0.005 |
| Davies’ diameter (µm) | 2.01 |
SEM images were captured to examine the structure (the five layers) of the CPC material. Figure 2 shows a typical SEM image of the outer surface sample.
In the foreground, the S-layer can be observed and in the background, the M-layer. It must be noted that even at higher magnification, the three S-layers were indistinguishable one from the other. The solid masses represent areas of calendering, i.e. a joining point of all 5 layers to ensure their physical cohesion.
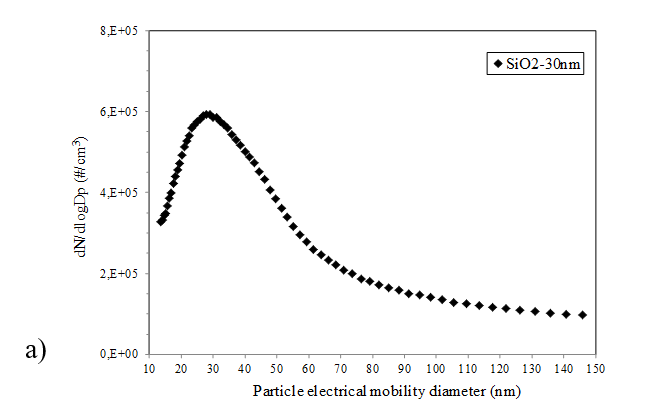
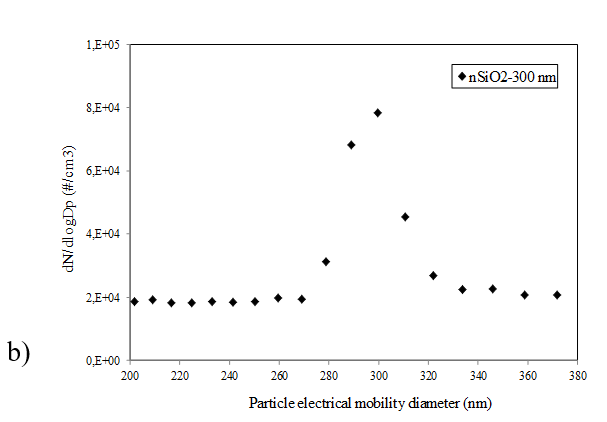
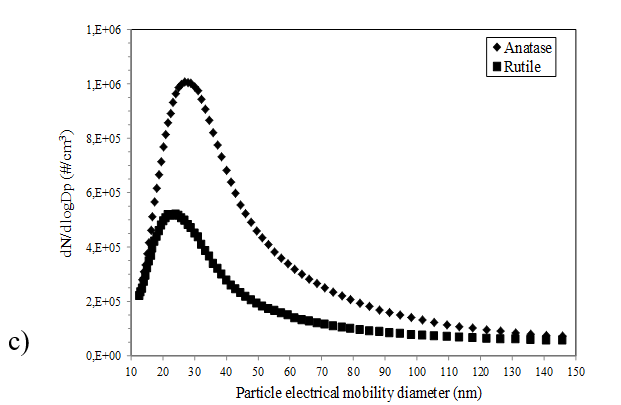
Before the penetration tests, the size distributions of all aerosols were determined with the SMPS. As displayed in Figure 3-a and 3-b, size distributions of nSiO2-30 nm and nSiO2-300 nm monodisperse particles were centered at 28 nm and 300 nm respectively. Although the nSiO2-30 nm solution was monodisperse and had been sonicated before use, it appears that its distribution was wide-ranging and contained more large size diameters. This was probably due to the presence of aggregates and agglomerates. As displayed in Figure 3-c, the anatase and rutile size distributions were generated with a diameter corresponding to the manufacturer’s data.
3. 2. Effect of Size
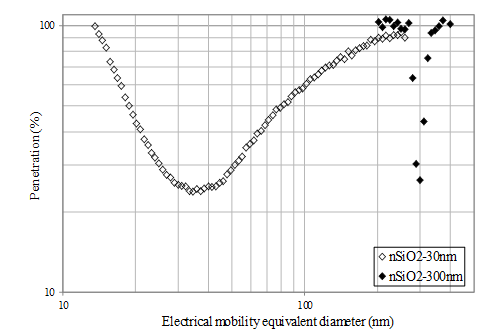
The first parameter to be studied was the size of the airborne nanoparticles. Numerous studies, conducted with screen and nonwoven filters, report an increase in penetration as the electrical mobility diameter is increased, with a Most Penetrating Particle Size (MPPS) greater than 300 nm [25], [26]. In the present work, minimum penetration was reached at 24% for nSiO2-30 nm and 26% for nSiO2-300 nm (Figure 4). A difference of 2% is insignificant, which would lead to the conclusion that penetration is equivalent for both sizes of particles. However, this is inconsistent with other studies found in the literature. Based on these, the penetration of nSiO2-30 nm should have been less than that of the nSiO2-300 nm.
This contradiction could be attributed to the face velocity applied during the penetration tests. The previous works on airborne particle filtration used different face velocities: from 2 to 40 cm/s for Wang (2013), 2.92 and 5.85 cm/s for Chang and Zhou (2017), and 1 to 50 cm/s for Thomas et al. (2001) [25]-[27]. In all of these cases, the face velocities were far greater than that of the present study (0.435 cm/s). Furthermore, the main mechanisms of collection for airborne nanoparticles that are less than 300 nm are diffusion and interception and for those under 100 nm, diffusion [15], [29], [31]. Thus, only diffusion should be considered for nSiO2-30 nm, whereas both mechanisms can be considered for nSiO2-300 nm.
Diffusion is proportional to face velocity. The lower the face velocity, the greater the diffusion mechanism [29]. Thus, in this study, the penetration of nSiO2-30 nm due to collection by diffusion was similar to that of nSiO2-300 nm penetration with the presence of both mechanisms. It should be noted that face velocity has no effect on the interception mechanism.
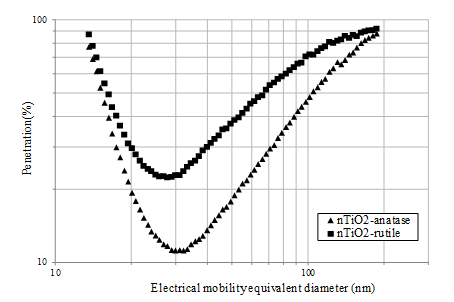
3. 3. Effect of Morphology
The effect of the shape of the airborne nanoparticles was evaluated using nTiO2-anatase (spherical morphology) and nTiO2-rutile (rod morphology). Figure 5 shows the experimental penetration for nTiO2-anatase and nTiO2-rutile through CPC material as a function of the mobility diameter. Up to 15 nm, the penetration of both airborne nanoparticles overlaps. Beyond 15 nm and across the entire size range, the penetration of nTiO2-anatase was systematically below the penetration levels of nTiO2-rutile. The maximum in this gap was observed for nanoparticles measuring approximately 30 nm. While the penetration of nTiO2-rutile was 22%, that of nTiO2-anatase was only 11%. This result was in agreement with the conclusion from Boskovic et al. [32]. Indeed, Boskovic et al. compared the filtration efficiency of spherical particles of iron oxide and perfect cubes of magnesium oxide for particle sizes between 50 and 300 nm. They concluded that the filtration efficiency was much higher for spherical particles than for cubic ones. To explain this, they proposed that cubic particles slide and tumble contrary to the spherical particles, which slide or roll before coming to a stop. In the case of cubic particles, settling can modify the surface contact between the fibers and particles and consequently decrease the possibility of the particles staying hooked onto the fibers. They also confirmed the previous results with spherical polystyrene latex particles, perfect cubes of magnesium oxide and cubic NaCl particles with rounded corners [33]. The filtration efficiency for spherical polystyrene latex particles was higher than that of NaCl particles, which was higher than that of perfect cubes of magnesium oxide. However, it should be noted that these conclusions were valid for a low face velocity (0.02 m/s and 0.05 m/s respectively). For a face velocity of 0.2 m/s, no significant impact due to shape was measured in the filtration efficiency. In the present study, the face velocity was lower still, U0=0.00435 m/s.
In conclusion of this section, the filtration efficiency of CPC materials follows the same trend as the filter media used in respiratory protective devices.
3. 4. Long-Time Exposure – Clogging Effect
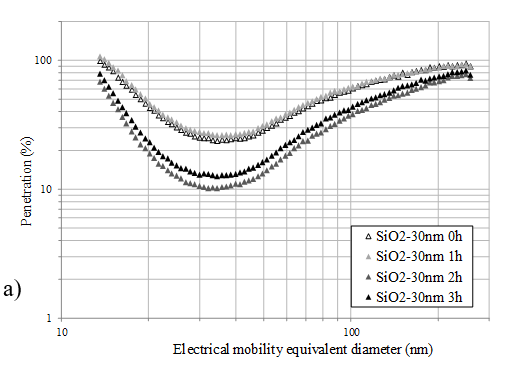
CPC material samples were exposed to airborne nanoparticles during 1, 2 and 3 hours to evaluate the clogging effect on the level of penetration (Figure 6). For nSiO2-30 nm, after 1 hour of exposure, clogging was not noteworthy in comparison with the penetration measured at the beginning of the test. Indeed, both penetration curves overlapped over the size range (Figure 6-a). Minimum penetration was reached at 26%. In contrast, after 2 and 3 hours of exposure, the penetration decreased and attained 10-13% respectively. Considering the standard deviations, this difference of 3% was not significant. Thus it could be considered that the gap in the penetration levels decreased by 15-20% after 2-3 hours of exposure for particles around 30 nm. Moreover, the clogging effect curve did not progressively follow the exposure time. As presented by Japuntich et al. [34], the evolution of the penetration follows two phases. The first occurs during the first two hours in the present case and corresponds to a “depth loading” until a filter cake formation point (between hours 2 and 3, but not defined exactly). The second phase consists in a linear increase in particle loading. Contrary to this, no difference was observed in this study between hours 2 and 3, probably because of the small size of the particles. Perhaps an exposure time of 4 hours and more could prove the linear increase proposed by Japuntich et al.
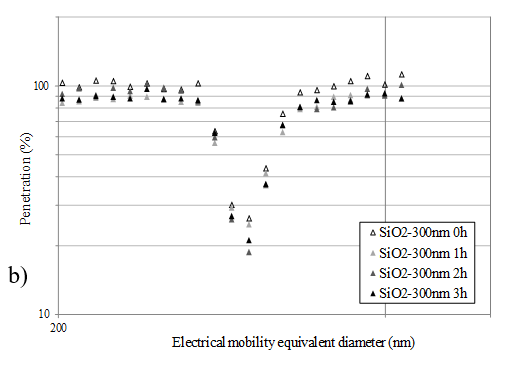
For nSiO2-300 nm, the same trend seemed to appear (Figure 6-b). Here again, the penetration at the beginning and the penetration after 1 hour was 26% while it was 20% after 2 or 3 hours. However, the effect was less pronounced than that seen for nSiO2-30 nm. The reason why the clogging effect was more significant with the small particles (30 nm) could be explained by the efficiency of the collection mechanisms. Indeed, the low face velocity prioritizes the diffusion mechanism and not interception, which is the main mechanism for bigger particles (300 nm).
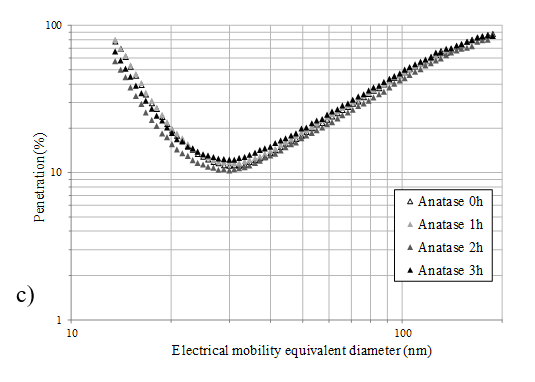
In view of the standard deviations for nTiO2-anatase (6.7% at 0h, 4.5% at 1h, 5.1% at 2h and 9.6% at 3h), it can be considered that there is no clogging effect regardless of the exposure time (Figure 6-c).
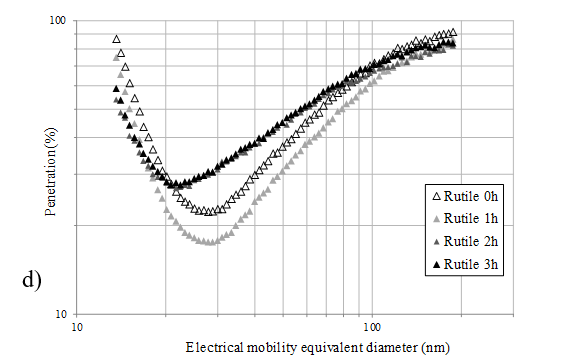
Figure 6-d displays strange trends of the penetration of nTiO2-rutile as a function of the exposure time. At the beginning of the tests, the penetration was around 22% for 28 nm-particles and after 1 hour of exposure, the penetration level decreased to 18% for the same range of particles. However, after 2 and 3 hours of exposure, the minimum penetration increased to 28% and more, a surprising shift towards small sizes was observed (25 nm-particles). However, despite the fact that different profiles of penetration appeared for nTiO2-rutile, the standard deviations in this case were too great (between 11.2% and 13.5%) to allow for any conclusion as to the effect of the exposure time on the level of clogging.
3. 5. Influence of the Clogging Effect on the Pressure Drop
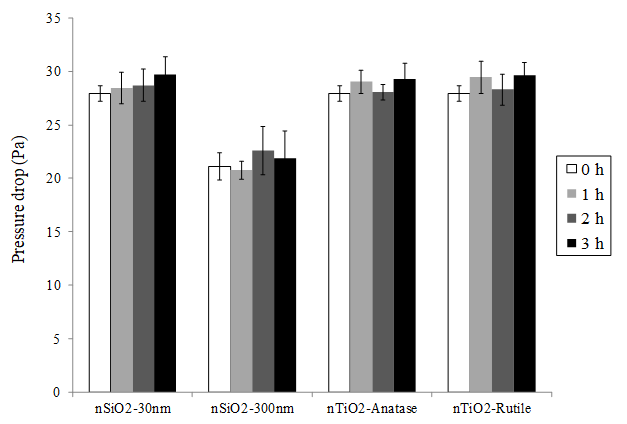
This final section determined the behaviour of the pressure drop as a function of the clogging effect. For each type of airborne nanoparticles and experiment durations, the pressure drop was measured. As shown in Figure 7, the mean values of the pressure drop were constant during the period of clogging for nSiO2-30 nm, nTiO2-anatase and nTiO2-rutile (28.7 ± 1.4, 28.6 ± 1.1, 28.8 ± 1.4) Pa respectively. For nSiO2-300 nm, it was 21.6 ± 1.9 Pa. Although some studies deal with mathematical [35], [36] or experimental [27] predictions of pressure drop during clogging, in the present work and considering the standard deviations, the exposure time and clogging did not seem to influence the pressure drop. As shown by Thomas et al. [27], the pressure drop increases with the face velocity. For low face velocity, the pressure drop varies very slowly as does the quantity of collected nanoparticles. In the present work, the value of the face velocity was very low (0.435 cm/s), which could explain why the pressure drop seemed constant. More investigations are needed to confirm an increase of the pressure drop and consequent increase in clogging for higher face velocities.
If the shape variable (nTiO2-anatase and nTiO2-rutile) had no effect on the pressure drop, it is interesting to note the difference observed between nSiO2-30 nm and nSiO2-300 nm. The pressure drop occurring with aerosol nanoparticle filtration is lower as the particle size is greater. This significant difference can be linked to the penetration curves presented in Figure 6-a and Figure 6-b. As indicated in section 4.3, the penetration of nSiO2-30 nm was less significant (10-13%) than that of nSiO2-300 nm (20%). This means that, if the penetration were higher (case of nSiO2-300 nm), the clogging effect and thus the pressure drop would be lower. The size effect has a significant impact on the pressure drop. As indicated by Thomas et al. (2001), the larger particles have a smaller specific surface which leads to low collection, thus a smaller pressure drop [27]. This hypothesis can be correlated with the other nanoparticles. Indeed, nSiO2-30 nm, nTiO2-anatase and nTiO2-rutile were in the same size range and the pressure drops measured for each were comparable.
4. Conclusion
If numerous studies have been published on the filtration of airborne nanoparticles through protective respiratory materials such as screen, woven or nonwoven filters, to the best of our knowledge, it is the first time that a study examines the effect of an engineered airborne nanoparticle’s morphology and size on the efficiency of filtering materials used in chemical protective clothing. Moreover, contrary to most of the previous works, the tests here were performed with nanoparticles found abundantly in the workplace, such as nSiO2 and nTiO2.
Firstly, the results show that nSiO2 particle size does not seem to affect the level of penetration. This is probably due, in the present work, to the low face velocity of the airborne nanoparticles. As mentioned in numerous studies, MPPS is localized for particles around 300 nm, which corresponds to the results obtained with nSiO2-300 nm. But in the present work, the low face velocity prioritizes the collection mechanism of diffusion and this could explain the comparable penetration levels measured with nSiO2-30 nm and nSiO2-300 nm.
On the other hand, the results show that the shape of the nanoparticles has a significant effect on penetration. The spherical particles (nTiO2-anatase) penetrated through the material samples less than the rod shape particles (nTiO2-rutile). This behavior is identical to that observed for filter media used in respiratory protective devices.
The deposit of particles on the fibers contributed to an increase in the clogging effect only in the case of nSiO2-30 nm and the clogging effect was less pronounced for nSiO2-300 nm. For nTiO2-rutile, no conclusion can be drawn, because of the significant standard deviations of the data.
If some clogging effect can be seen with the penetration curves, no influence was detected on the pressure drop. In fact, the pressure drop was a macroscopic data and it was probably not sensitive enough to determine the clogging effect using the low face velocity as was used in this study. However, the size of the particles seems to have a significant impact on the pressure drop.
This work was an exploratory study and other paths need to be investigated. Firstly, HR-SEM (High Resolution – Scanning Electron Microscopy) images could have made it possible to see and maybe quantify the amount of deposits of nSiO2 and nTiO2 on the filtering fibers. Moreover, before testing a CPC material in its entirety, in a future work, only the filtering layer (referred to as M-layer here) would be analysed and models could be developed. Investigation would then need to be expanded to other CPC materials and particularly to their filtering layer. Finally, in the medium term, temperature and relative humidity are parameters that greatly influence the filtration mechanisms, especially diffusion, and therefore the smallest particles. These two parameters could also be the subject of a future study on the effectiveness of CPC materials against airborne nanoparticles.
Acknowledgements
The authors wish to acknowledge Professor Patrice Seers and Michel Orsini (École de technologie supérieure) for the SMPS and Mehdi Ben Salah for the CPC material characterization (École de technologie supérieure).
Conflict of interest
The authors declare having no conflict of interest with the manufacturers of the CPCs used in this study.
References
[1] R. Fries and M. Simkó, “(Nano-)Titanium dioxide (Part I): Basics, Production, Applications,” in Nano Trust dossiers, Institute of Technology Assessment of the Austrian Academy of Sciences, pp. 1-4, 2012. [2] “Research and Markets, Global Titanium Dioxide Nanomaterials Market 2015-2019,” Research and Markets, pp. 101, 2015.
[2] “Research and Markets, Global Titanium Dioxide Nanomaterials Market 2015-2019,” Research and Markets, pp. 101, 2015.
[3] H. Flynn, D. Hwang, and M. Holman, “Nanotechnology update: corporations up their spending as revenues for nano-enabled products increase,” LuxResearch Inc., Boston, MA, 2014.
[4] International Agency for Research on Cancer, “Monographs on the evaluation of carcinogenic risks to humans - carbon black, titanium dioxide and talc,” World health organization, Lyon, 2010.
[5] Y. Q. Zhang, Y. S. Lin, X. Li, L. Zhang, W. Pan, H. L. Zhu, Z. G. Xi and D. F. Yang, “Silica dioxide nanoparticles combined with cold exposure induce stronger systemic inflammatory response,” Environmental Science and Pollution Research, vol. 24, no. 1, pp. 291-298, 2017.
[6] J. H. Kim, C. S. Kim, R. M. C. Ignacio, D. H. Kim, M. E. J. Sajo, E. H. Maeng, X. F. Qi, S. E. Park, Y. R. Kim, M. K. Kim, K. J. Lee and S. K. Kim, “Immunotoxicity of silicon dioxide nanoparticles with different sizes and electrostatic charge,” International Journal of Nanomedicine, vol. 9, pp. 183-193, 2014. View Article
[7] J. W. Yun, S. H. Kim, J. R. You, W. H. Kim, J. J. Jang, S. K. Min, H. C. Kim, D. H. Chung, J. Jeong, B. C. Kang and J. H Che, “Comparative toxicity of silicon dioxide, silver and iron oxide nanoparticles after repeated oral administration to rats,” Journal of Applied Toxicology, vol. 35, no. 6, pp. 681-693, 2015. View Article
[8] J. Wu, W. Liu, C. Xue, S. Zhou, F. Lan, L. Bi, H. Xu, X. Yang, and F. Zeng, “Toxicity and penetration of TiO2 nanoparticles in hairless mice and porcine skin after subchronic dermal exposure,” Toxicology Letters, vol. 191, no. 1, pp. 1-8, 2009. View Article
[9] D. H. Brouwer, S. Spaan, M. Roff, A. Sleeuwenhoek, I. Tuinman, H. Goede, B. van Duuren-Stuurman, F. Larese Filon, D. Bello and J. W. Cherrie, “Occupational dermal exposure to nanoparticles and nano-enabled products: Part 2 - Exploration of exposure processes and methods of assessment,” International Journal of Hygiene and Environmental Health, vol. 219, no. 6, pp. 503-512, 2016. View Article
[10] F. Larese Filon, D. Bello, J. W. Cherrie, A. Sleeuwenhoek, S. Spaan and D. H. Brouwer, “Occupational dermal exposure to nanoparticles and nano-enabled products: Part 1 - Factors affecting skin absorption,” International Journal of Hygiene and Environmental Health, vol. 219, no. 6, pp. 536- 544, 2016. View Article
[11] F. Larese Filon, M. Crosera, M. Mauro, E. Baracchini, M. Bovenzi, T. Montini, P. Fornasiero and G. Adami, “Palladium nanoparticles exposure: Evaluation of permeation through damaged and intact human skin,” Environmental Pollution, vol. 214, pp. 497-503, 2016. View Article
[12] F. Larese Filon, M. Mauro, G. Adami, M. Bovenzi and M. Crosera, “Nanoparticles skin absorption: New aspects for a safety profile evaluation,” Regulatory Toxicology and Pharmacology, vol. 72, no. 2, pp. 310-322, 2015. View Article
[13] C. Brochot, N. Michielsen, S. Chazelet and D. Thomas, “Measurement of Protection Factor of Respiratory Protective Devices Toward Nanoparticles,” Annals of Occupational Hygiene, vol. 56, no. 5, pp. 595-605, 2012. View Article
[14] C. Brochot, G. Mouret, N. Michielsen, S. Chazelet and D. Thomas, “Penetration of nanoparticles in 5 nm to 400 nm size range through two selected fibrous media,” Journal of Physics: Conference Series, vol. 304, no. 1, pp. 012068, 2011.
[15] J. Wang, D. R. Chen and D. Y. H. Pui, “Modeling of filtration efficiency of nanoparticles in standard filter media,” Journal of Nanoparticle Research, vol. 9, no. 1, pp. 109-115, 2007. View Book
[16] N. Rao and M. Faghri, “Computer Modeling of Aerosol Filtration by Fibrous Filters,” Aerosol Science and Technology, vol. 8, pp. 133-156, 1988. View Article
[17] A. Brochocka, K. Makowski and K. Majchrzycka, “Penetration of different nanoparticles through melt blown filter media used for respiratory protective devices,” Textile Research Journal, vol. 82, no. 18, pp. 1906-1919, 2012. View Article
[18] Y. S. Cheng, T. D. Holmes and B. Fan, “Evaluation of Respirator Filters for Asbestos Fibers,” Journal of Occupational and Environmental Hygiene, vol. 3, no. 1, pp. 26-35, 2006. View Article
[19] L. Golanski, A. Guiot, F. Rouillon, J. Pocachard and F. Tardif, “Experimental evaluation of personal protection devices against graphite nanoaerosols: fibrous filter media, masks, protective clothing, and gloves,” Human and Experimental Toxicology, vol. 28, no. 6-7, pp. 353- 359, 2009. View Article
[20] J. Park, B. Kwak, K. Younghun and Y. Jongheop, “Efficiency of protective dermal equipment against silver nanoparticles with water aerosol,” Journal of Nanoparticle Research, vol. 13, no. 7, pp. 3043- 3049, 2011. View Article
[21] P. Gao, P. A. Jaques, T. Hsiao, A. Shepherd, B. C. Eimer, M. Yang, A. Miller, B. Gupta and R. Shaffer, “Evaluation of Nano- and Submicron Particle Penetration through Ten Nonwoven Fabrics Using a Wind-Driven Approach,” Journal of Occupational and Environmental Hygiene, vol. 8, no. 1, pp. 13-22, 2010. View Article
[22] M. Ben Salah, S. Hallé and L. Tuduri, “Efficiency of five chemical protective clothing materials against nano and submicron aerosols when submitted to mechanical deformations,” Journal of Occupational and Environmental Hygiene, vol. 13, no. 6, pp. 425- 433, 2016. View Article
[23] L. Vinches and S. Hallé, “Resistance of Type 5 chemical protective clothing against nanometric airborne particles: Behavior of seams and zipper,” Journal of Occupational and Environmental Hygiene, vol. 14, no. 12, pp. 1-8, 2017.
[24] S. C. Kim, J. Wang, M. S. Emery, W. G. Shin, G. W. Mulholland and D. Y. H. Pui, “Structural Property Effect of Nanoparticle Agglomerates on Particle Penetration through Fibrous Filter,” Aerosol Science and Technology, vol. 43, no. 4, pp. 344-355, 2009. View Article
[25] J. Wang, “Effects of Particle Size and Morphology on Filtration of Airborne Nanoparticles,” Kona Powder and Particle Journal, no. 30, pp. 256-266, 2013. View Article
[26] Y. S. Cheng and Y. Zhou, “Effects of size and shape on filtration of TiO2 nanoparticles,” Aerosol Science and Technology, vol. 51, no. 8, pp. 972-980, 2017. View Article
[27] D. Thomas, P. Penicot, P. Contal, D. Leclerc and J. Vendel, “Clogging of fibrous filters by solid aerosol particles experimental and modelling study,” Chemical Engineering Science, vol. 56, no. 11, pp. 3549-3561, 2001. View Article
[28] P. Contal, J. Simao, D. Thomas, T. Frising, S. Callé, J. C. Appert-Collin and D. Bémer, “Clogging of fibre filters by submicron droplets. Phenomena and influence of operating conditions,” Journal of Aerosol Science, vol. 35, no. 2, pp. 263-278, 2004. View Article
[29] W. C. Hinds, Aerosol Technology: Properties, Behavior, and Measurement of Airborne Particles, 2nd ed. Wiley-Interscience, 1999. View Book
[30] Standards Council of Canada, “Textile Test Methods: Fabric Thickness,” CAN/CGSB-4.2 no. 37-2002 (R2013), 2002.
[31] J. Wang, S. C. Kim, and D. Y. H. Pui, “Figure of merit of composite filters with micrometer and nanometer fibers,” Aerosol Science and Technology, vol. 42, no. 9, pp. 722-728, 2008. View Article
[32] L. Boskovic, I. E. Agranovski, R. D. Braddock, T. Myojo and M. Choi, “Influence of Particle Shape on Filtration Processes,” Aerosol Science and Technology, vol. 39, no. 12, pp. 1184-1190, 2005. View Article
[33] L. Boskovic, I. E. Agranovski and R. D. Braddock, “Filtration of nano-sized particles with different shape on oil coated fibers,” Journal of Aerosol Science, vol. 38, pp. 1220-1229, 2007. View Article
[34] D. A. Japuntich, J. I. T. Stenhouse and B. Y. H. Liu, “Experimental results of solid monodisperse particle clogging of fibrous filters,” Journal of Aerosol Science, vol. 25, no. 2, pp. 385-393, 1994. View Article
[35] V. J. Novick, P. J. Higgins, B. Dierkschiede, C. Abrahamson, W. B. Richardson, P. R. Monson, P. G. Ellison, “Efficiency and mass loading characteristics of a typical HEPA filter media material,” in Proceedings of the 21st DOE/NRC nuclear air cleaning conference, United States of America, vol. 22, no. 23, pp. 783-798, 1991.
[36] C. Kanaoka and S. Hiragi, “Pressure drop of air filter with dust load,” Journal of Aerosol Science, vol. 21, no. 1, pp. 127-131, 133-137, 1990. View Article