International Journal of Theoretical and Applied Nanotechnology (IJTAN)
ISSN: 1929-1248

Volume 11 - Year 2023 - Pages 01-08
DOI: 10.11159/ijtan.2023.001
Development and Evaluation of Lipid-Based Formulations for Liver Cancer: A Comparative Study of Solid Lipid Nanoparticles vs. Nanostructured Lipid Carriers
Mina Gayed1, Dina M. Gaber2, Nabila Borae1
1Department of Pharmaceutics, Alexandria University.
Alexandria, Egypt, 21521; gs-mina.gayed@alexu.edu.eg; nabila.boraie@alexu.edu.eg
2 Pharmaceutical Sciences division (Pharmaceutics), College of Pharmacy, Arab Academy for Science, Technology and Maritime Transport
Abu Kir Campus, Alexandria, Egypt, 1029
dinagaber@aast.edu
Abstract - To investigate the influence of the physical state and composition of lipid materials on the preparation performance of lipid nanocarriers, two types of carriers were prepared and compared: solid lipid nanoparticles (SLNs), nanostructured lipid carriers (NLCs).
To assess the ability of these nanocarriers to promote effective drug delivery of drug to liver for management of liver cancer, Fenretinide (FEN) was employed as a model drug. The FEN encapsulation efficiency in these NLCS was greater than 97% compared to 93% for SLNs. Further loading capacity increased 2 folds in case of NLCs. Furthermore, the unchanged size and size distribution of these nanoparticles for 3 months at room temperature demonstrated their stability in such conditions. However, MTT experiments proved that FEN-SLNs are more effective for delivering FEN to HepG2 cells than NLCs with 3 folds enhancement in cytotoxic activity.
Therefore, this study showed that by optimally controlling the lipid physical state and composition, it is possible to fabricate the solid lipid nanoparticles with desired properties.
Keywords: Liver cancer, lipid based nanocarriers, loading efficiency.
© Copyright 2023 Authors - This is an Open Access article published under the Creative Commons Attribution License terms. Unrestricted use, distribution, and reproduction in any medium are permitted, provided the original work is properly cited.
Date Received: 2023-08-20
Date Revised: 2023-09-23
Date Accepted: 2023-09-25
Date Published:2023-09-29
1. Introduction
Primary liver cancer is a huge public health concern across the world. Hepatocellular carcinoma (HCC) is the world's fifth most prevalent neoplasm and the third leading cause of cancer-related mortality [1]. HCC treatments are traditionally classified as curative or palliative. The primary curative approach is surgical resection; however, it is severely restricted in individuals with numerous or metastatic tumours [2]. As a result, finding effective chemotherapeutic drugs to enhance the survival rate of patients with advanced or recurrent HCC following surgical therapy is critical. Thus, the development of new drugs is required for optimal treatment with fewer complications. All-trans retinoic acid (ATRA) has been shown to efficiently induce the differentiation of acute promyelocytic leukaemia cells [3]; however, it does not treat patients with liver cancer because liver cancer demands a concentration approximately ten times greater than leukemic cells [1]. Due to many negative effects, including retinoic acid syndrome, skin dryness, and liver damage, such high doses are not acceptable for therapeutic usage. The effects of Fenretinide (FEN), a synthetic derivative of retinoic acid, differ considerably from those of ATRA. FEN is now thought to be a medication with fewer adverse effects [4]. In addition, it is reported to be used as a chemo preventive for different type of cancers such as Breast, Prostate, Pancreas, and skin cancer [5]. However, working with this drug is challenging on various levels due to its poor physicochemical properties, for instance it is highly hydrophobic, low bioavailability, as well as its sensitivity towards light and heat [6]. In addition, this drug is not readily available in the market. To overcome these problems, the use of colloidal delivery systems has been developed. In fact, the colloidal delivery method has shown to be a capable pathfinder in deciphering the practical issues involved with drugs [7]. For lipophilic compounds, different lipid-based delivery methods such as SLNs, NLCs, nanoemulsions, and liposomes have attracted significant interest. Both SLNs and NLCs are the most widely researched lipid-based delivery methods. These systems become industrially feasible because to their large-scale manufacturing practicality, nontoxicity, and simple availability of excipients. In addition, by maintaining suitable hydrophilic and lipophilic balance it is possible to fabricate nanosized carriers. Among these nanocarriers SLNs are produced using lipids which are solid at room and body temperature [8]. Further, if these lipid nanocarriers are created by partly combining solid and liquid lipids, they generate nanoparticles with additional internal flaws known as NLCs [8]. In comparison to SLNs, this allows for more drug molecules to be accommodated within the core area.
Therefore, the main purpose of this study was to produce both FEN loaded SLNs and NLCs and to study the effect of difference in physical state and composition of each delivery system on nanocarrier formation and to provide effective management of liver cancer. The effects of these critical parameters on produced delivery system were evaluated by taking following criteria as indicators: size, zeta potential, FEN loading and encapsulation efficiency, controlled drug release and in vitro cytotoxicity study on HEP G2 cells besides stability study for product performance.
2. Materials And Methods
2.1.1. Materials
Sigma-Aldrich in Canada provided Fenretinide (high purity, >98%). Gattefosse, Lyon, France, graciously contributed samples of lipids (Gelucire 50/13 and Precirol). BASF, Ludwigshafen, Germany, provided the Miglyol. El-Nasr Pharmaceutical Co, Cairo, Egypt, supplied the potassium dihydrogen phosphate. Polysciences, Europe GmbH in Germany provided the coumarin-6. Acetonitrile HPLC grade was bought from Fischer Scientific in Pittsburgh, Pennsylvania. HepG2 cell line, obtained from American Type Culture Collection, Dulbecco’s Modified Eagle Media (DMEM), Foetal Bovine Serum (FBS), Penicillin and streptomycin were purchased from Sigma-Aldrich, Canada.
2.2. Drug solubility in lipids (solid and liquid)
As mentioned in our previous study [9], FEN solubility was tried in both solid and liquid lipids. Briefly, FEN was added to molten lipids in ratio 1:10 (Gelucire 43/01, Gelucire 50/13, Compritol 888 ATO, Precirol ATO5, Precirol, Miglyol and Oleic acid) the solid lipids were melted at 5°C above the lipid melting point. After that, the drug solubility was observed visually and under optical microscope to see if there are any drug crystals. The total weight of FEN in the melted lipid that exhibit no crystals under the microscope is deemed FEN solubility in the lipid.
2.3. Preparation of lipid-based formulations (SLNs/ NLC)
2.4. Preparation of FEN-SLNs
In brief, FEN-SLNs were prepared by hot homogenization technique [10]. First, FEN (0.05% w/v) was added to the melted lipids (Gelucire 50/13 and Precirol) in water bath at 80 °C. Hereafter, preheated milli Q water was added dropwise at the same temperature under stirring rate at 800 rpm. After that, the dispersion was homogenized at 15,000 rpm for 10 minutes at the same temperature followed by sonication at 40 °C for 10 minutes. Finally, nanoparticle dispersion was allowed to stabilize by stirring at room temperature at 600 rpm for 30 minutes.
2.4.1. Preparation of FEN-NLCs
In a trial to increase drug loading by 2 folds, FEN loaded nano structed lipid carriers (FEN-NLCs) were prepared. Similarly, NLCs were prepared with hot homogenization method as previously discussed above. FEN (1% w/v) was dissolved in mixture of solid lipid: liquid lipid in ratio (3:1) in water bath at 80 °C. Then aqueous phase was added to oily phase at same temperature and then proceed as above.
The formulations of both SLNs and NLCs (blank and drug loaded are described in Table 1).
Table 1: Composition of SLNs and NLCs formulations
|
Concentration (% w/v) |
||||
|
Formula code |
Drug |
Lipids |
Emulsifier |
|
|
FEN |
Precirol |
Miglyol |
G 50/13 |
|
|
Blank-SLNs |
— |
0.5 |
— |
0.5 |
|
FEN-SLNs |
0.05 |
— |
||
|
Blank-NLCs |
— |
0.03 |
||
|
FEN-NLCs |
0.1 |
0.03 |
||
2.5. Colloidal properties
The Zeta-Sizer Nano-ZS (Malvern Instruments, Malvern, UK) was used to assess the particle size, polydispersity index (PDI), and zeta potential of both blank and drug-loaded SLNs/ NLCs. Prior to measurements, the samples were adequately diluted with Milli Q water in a ratio of 1:10, followed by 5 minutes of sonication. All samples were tested in triplicate, and the findings were computed as the average of three samples plus the standard deviation.
2.6. Morphological properties
Transmission electron microscopy (TEM, JOEL, 100 CX, Japan) was used to examine the particle morphology of both blank and FEN loaded SLNs/NLCs. Samples were diluted with Milli Q water before being placed on the grid, dried, and stained with Uranyl acetate as a negative staining.
2.7. HPLC analysis of FEN
2.8. Calibration curve
In acetonitrile, a standard stock solution of FEN was produced at a concentration of 100 mg% w/v. The working solutions for the calibration curve were then created by diluting the stock solutions. In 10 ml volumetric flasks, different quantities corresponding to concentrations in the range of 0.1-1.0 mg% w/v were taken from the FEN stock solution and diluted with mobile phase (Acetonitrile: Water 90:10).
2.8.1. Chromatographic conditions and construction of calibration curve
The HPLC analysis was carried out using a system with a reverse phase C18 column. The isocratic mobile phase was eluted at a flow rate of 1 ml/min using a combination of acetonitrile and water (90:10 v/v). The injection volume was set at 20 μL. The diode array detector monitored the elution from 190 to 400 nm, and chromatograms were extracted at 360 nm. All measurements were taken at 26 °C. For each concentration, triplicate injections were prepared and chromatographed using the previously reported LC conditions.
2.9. Entrapment of FEN and loading efficiency
Using centrifugal ultrafiltration entrapment efficiency of both nano systems were assessed using Centrisart-I® MWCO 10kDa, Sartorius AG, Goettingen, Germany as previously reported by Nafee et al. [10]. Each Centrisart contained one mL of each FEN loaded formula then centrifuged at 5000 rpm for 10 minutes. Consequently, the encapsulated FEN was extracted from FEN-SLNs/ FEN-NLCs with acetonitrile and melt it in water bath at 80°C followed by sonication and then purified and measured with above mentioned validated HPLC method. The EE was calculated using the following equation[11]. The entrapment efficiency (EE) and loading efficiency (LE) of FEN were detected after drug extraction from loaded particles in acetonitrile. then melt it in water bath at 80°C followed by sonication and then filtered with 0.45 µm syringe filter. The % EE and% LE were calculated using the following equations:
|
% EE = (Amount of entrapped drug in loaded SLNs or NLCs/ Total drug content) ∗100 |
(1) |
%LE = (Amount of drug in loaded particles/ Total weight of SLNs or NLCs) ∗100 |
(2) |
2.10. In vitro drug release
The dialysis method was used to analyse the FEN release profile from SLNs/NLCs as previously reported. Briefly, in amber glass vials, 100 ml of phosphate buffer (pH 7.4): ethanol (1:1 v/v) were used as the release medium. three ml of SLNs or NLCs containing 0.05 and 0.1 %w/v FEN, respectively were injected in the dialysis bag. The dialysis bags used are (12–14 kda molecular weight cut off, VISKING dialysis tubing, SERVA, electrophoresis, Germany). The dissolution set was moved to a horizontal shaking incubator at 100 rounds/min, with temperature set at 37 ± 0.5°C. One ml sample was withdrawn at certain time intervals (1, 4, 6, 8, 24, 48, 72, and 96 h).
Every day the release medium was withdrawn and replaced with an equal volume of a pre-warmed fresh release medium. The amount of drug released was detected by the previously mentioned HPLC method after dilution sample with acetonitrile in ratio 1:1 and filter with 0.45 µm syringe filter.
2.11. In vitro cell viability assay
To ensure the potential antitumor activity of FEN-SLNS, FEN-NLCs and free FEN, MTT viability assay was carried out on hepatocellular carcinoma cell line, named; HepG2 using in-vitro assay kit MTT based; (Saint Louis, USA). HepG2 cell line, were cultured using Dulbecco’s Modified Eagle Media (DMEM) (Invitrogen/Life Technologies) supplemented with 10% Foetal Bovine Serum (FBS) and 1% penicillin-streptomycin. The cells were plated in complete growth medium (100 µL) + each compound (100 µL) per well in a 96-well plate for 48 h. cytotoxic activity was measured using MTT assay using manufacturer protocol (1). Absorbance is measured spectrophotometrically at λ = 570 nm. IC50 (inhibition concentration) values were calculated.
2.12. Storage Stability of the FEN-SLNs and FEN-NLCs dispersion
A short-term storage stability was performed to assess the effect of ageing on physical stability of FEN-SLNs and FEN-NLCs. Both FEN loaded SLNs and NLCs were stored in capped amber glass vials at 25 °C for a period of 3 months. The particle size distribution and PDI of the samples were monitored on the day of preparation and followed on after 1 and 3 months.
2.13. Statistical analysis
The results were expressed as means ± standard deviations (SD). Comparison of data groups were performed by one-way ANOVA using Statistical Procedures for the Social Sciences software (SPSS 20.0; SPSS Inc., Chicago, USA). Significant differences were considered at p value ≤ 0.05.
3. Results and discussion
3.1. Drug solubility
The key parameter to formulate a suitable lipid-based nanoparticle is the suitable choice of lipids. As our previous findings, both Gelucire 50/13 and Precriol have the most solubility [9]. Further, for liquid lipids, it was found that the incorporation of the liquid oil increased the amount of the drug incorporated in the chosen solid lipids. Miglyol was selected as an example for liquid lipids, as it was used in numerous NLCs for fat soluble vitamins [12] as well as it is considered as a main component for a nanoemulsion formulation for vitamin A [13].On the contrary, the use of oleic acid as an alternative oil did not show any promising results as observed with Miglyol.
3.2. Physicochemical characterization of SLNs/ NLCs
Table 2 depicted that, SLNs showed larger size for both blank and FEN-loaded particles in comparison to NLCs, which indicates that the latter has more compact structure.
Table 2: Colloidal properties of SLNs and NLCs (Blank/ drug loaded) (mean ± SD., n=3).
|
Formula |
Particle size (nm)± SD |
PDI ± SD |
Z.P (mV) ± SD |
|
Blank SLNs |
120 ± 1.54 |
0.23±0.007 |
-25± 1.63 |
|
FEN- SLNs |
290.4 ± 4.54 |
0.29 ± 0.031 |
-23.2 ± 3.61 |
|
Blank NLCs |
98.2±3.13 |
0.19± 0.043 |
-20.6±2.54 |
|
FEN - NLCs |
180 ± 1.94 |
0.24± 0.067 |
-19.41± 2.15 |
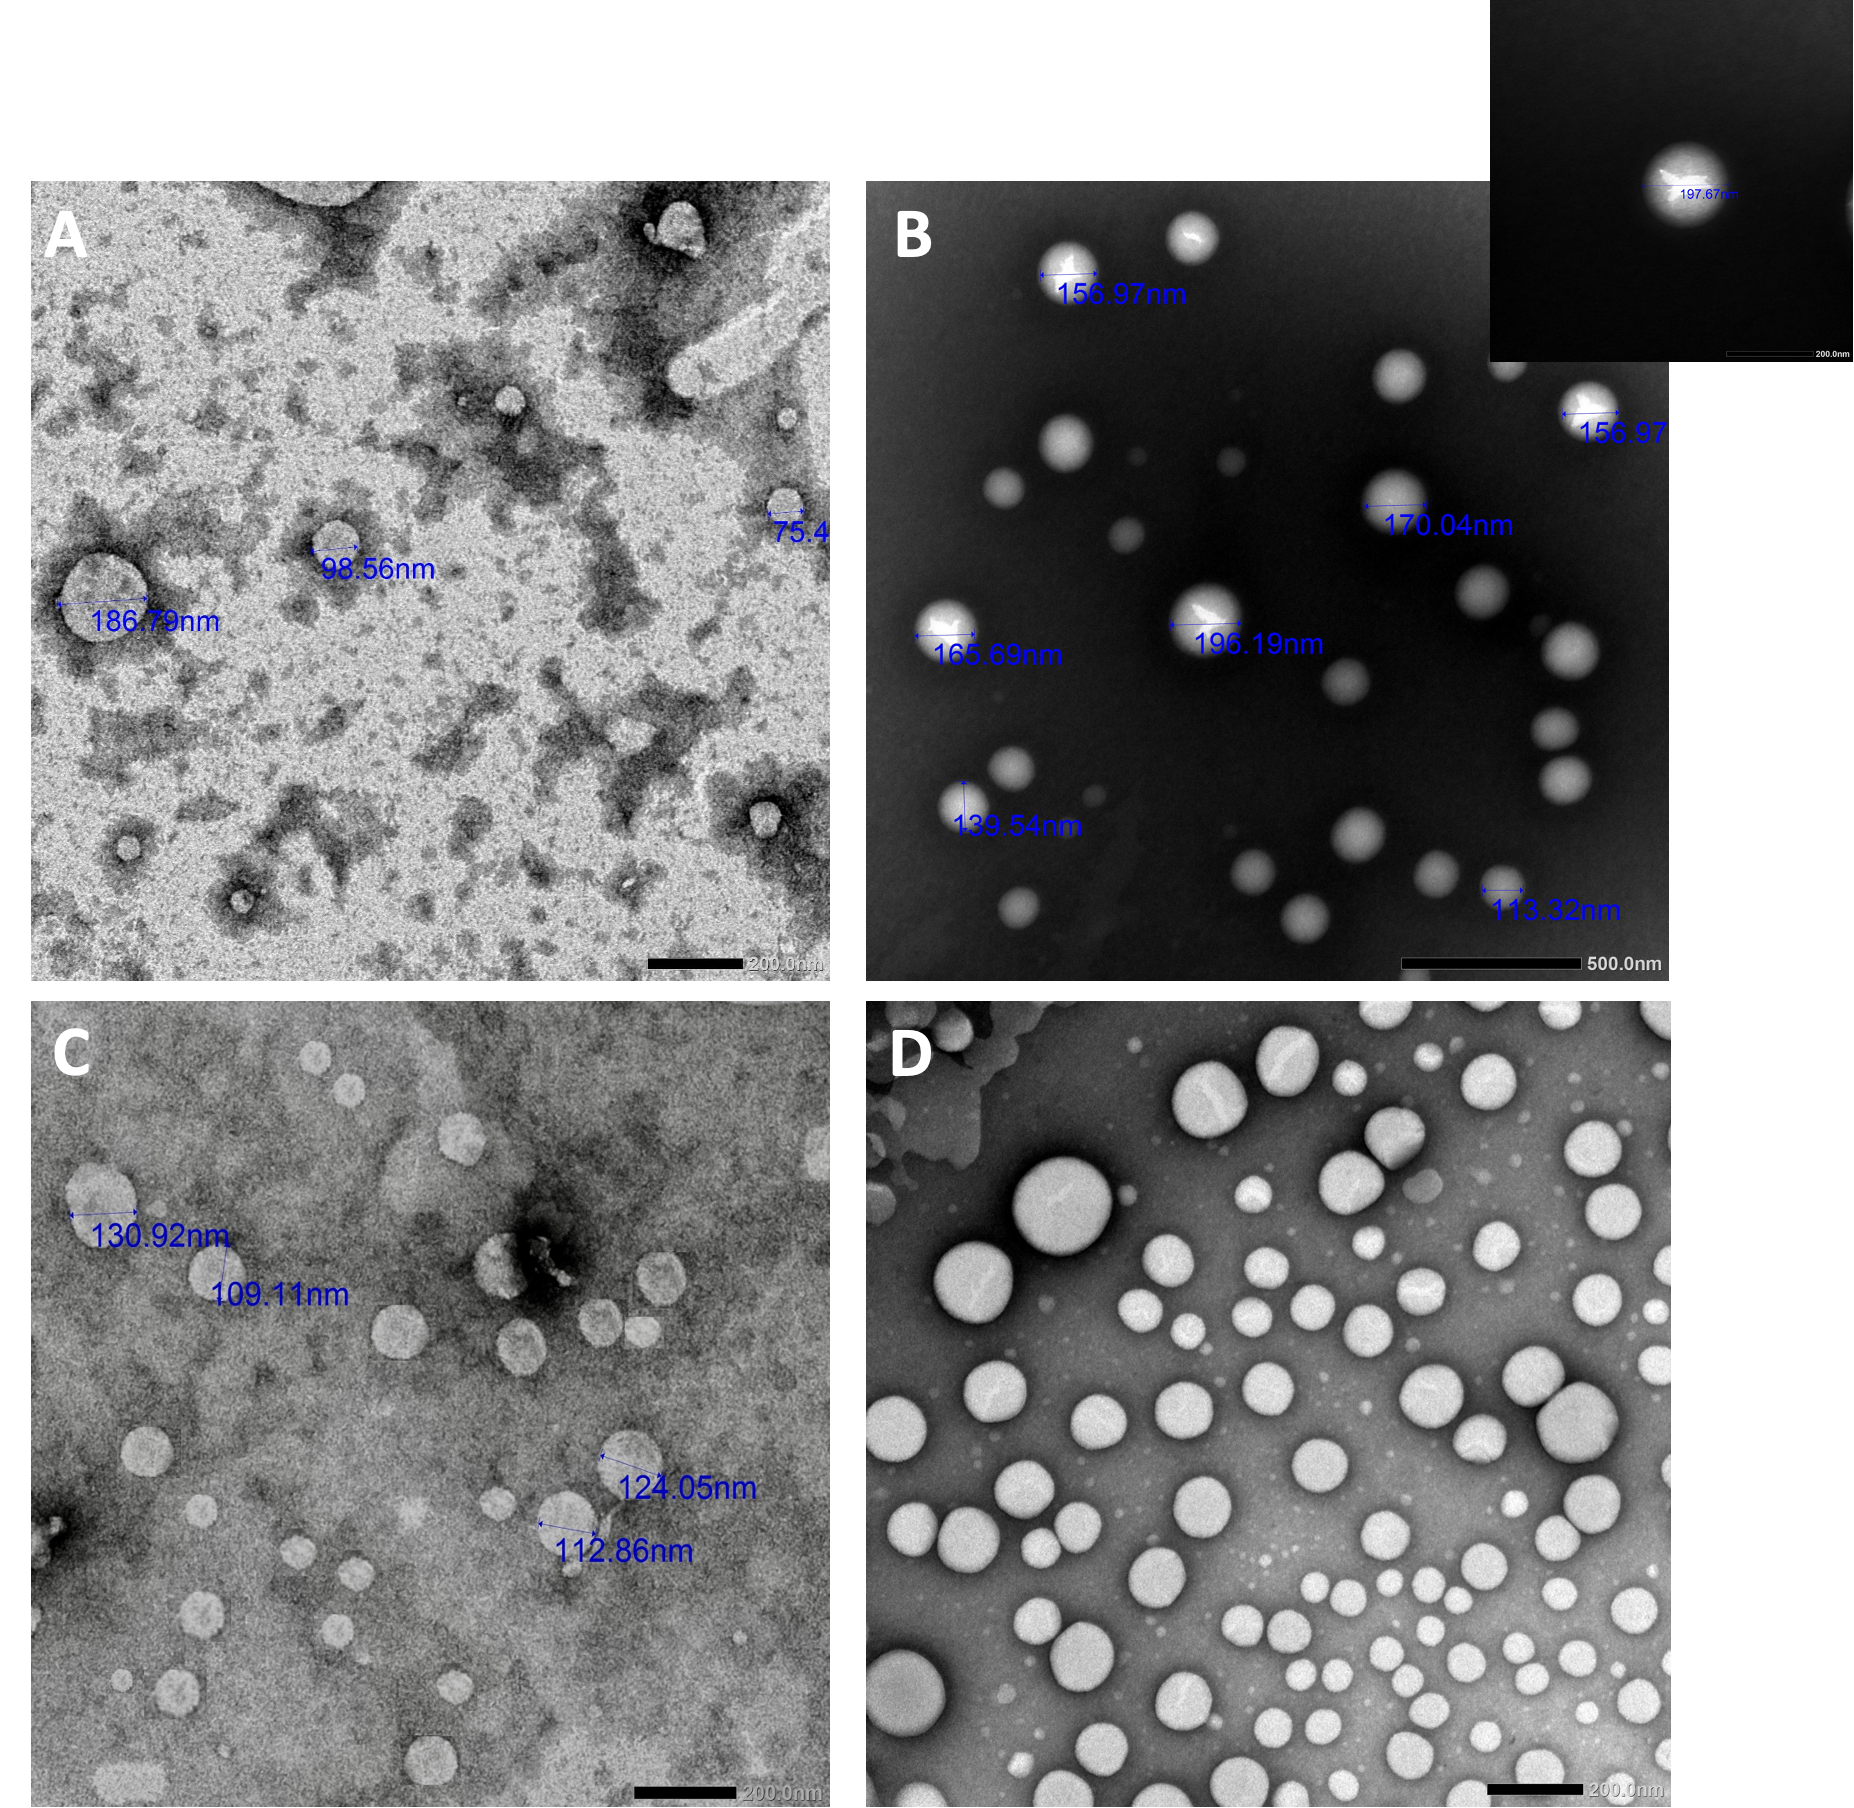
3.3. Morphological examination of SLNs &NLCs
The morphology of both SLNs and NLCs, blank and drug loaded was detected by TEM (Figure 1). Upon inspection, blank SLNs showed smaller particle size and looked more homogeneous than FEN-SLNs. This might be due to drug incorporation in SLNs resulted in adsorption of FEN on surface od SLNs and resulted in increase in particle size and that was confirmed by observing different phase contrast which reveals drug incorporation. On the other hand, similar behaviour was observed for NLCs. However, FEN-NLCs showed different phase contrast in the core which indicates the drug incorporation. Further, the particle size of NLCs (blank/ drug loaded) showed smaller particle size in comparison to SLNs. In addition, FEN-NLCs disclosed intense brightness in the core in comparison to FEN-SLNs. This display the capability of NLCs to entrap the drug into the lipid core unlike FEN-SLNs where the drug was attached to the nanoparticle surface.
3.4. HPLC analysis of FEN
3.4.1. Linearity and regression equation
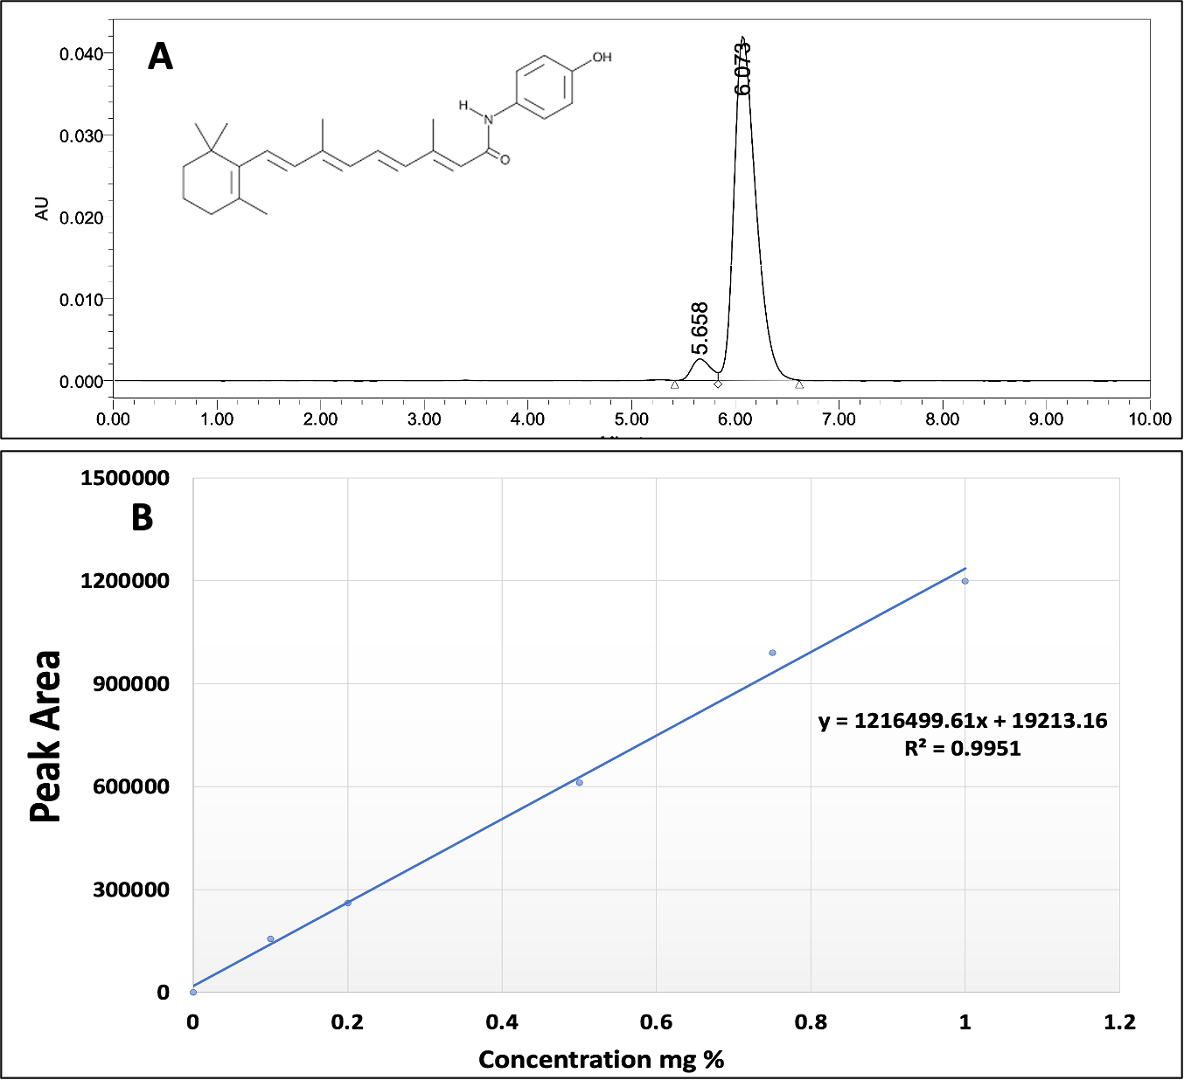
The concentration of FEN was measured by a validated HPLC method. the chromatogram Fig. 2A showed concentration 0.5 mg% w/v FEN solution diluted with mobile phase (Acetonitrile: Water 90:10). It also displays a symmetric and sharp peak with retention time 6.073 minutes. A plot of calibration curve between the peak area at 360 nm versus the respective drug concentration. The standard calibration curve was linearly correlated (R2=1) over different FEN concentration ranging from (0.1-1 mg% w/v) (Fig. 2B).
3.4.2. Limit of detection and Limit of quantification
The concentration of the analyte with a signal-to-noise ratio of 3:1 is known as the limit of detection (LOD). While considering the ratio is 10:1 is the limit of quantitation (LOQ). Using the signal-to-noise ratio calculation, the LOD and LOQ values were determined to be 0.297 and 0.901 mg % w/v, respectively. The suggested approach demonstrated low noise levels and high drug responses, which allow for the quantification and detection of low concentrations, according to both LOD and LOQ values.
3.4.3. Inter- and intra-day precision
To examine the method’s precision, five different concentrations of FEN were measured (3 replicate each) for each concentration during the same day and the following day as well. Intra-day, and inter-day precision were assessed respectively. The findings demonstrated that this HPLC method used for the calculation of FEN concentration had a high repeatability and accuracy, with relative standard deviation (%RSD) < 2%.
3.5. Entrapment efficiency and loading capacity.
The drug entrapment efficiency for FEN-SLNs and FEN-NLCs were 93.4 ± 1.06% and 96.2 ± 1.32%, respectively. Yet the loading capacity was doubled from 0.5mg/ ml for the former to 1mg/ ml for the latter. This could be due to the presence of Miglyol which enhanced the drug solubility in solid lipids and these results were previously confirmed by solubility study and TEM photomicrographs as discussed above.
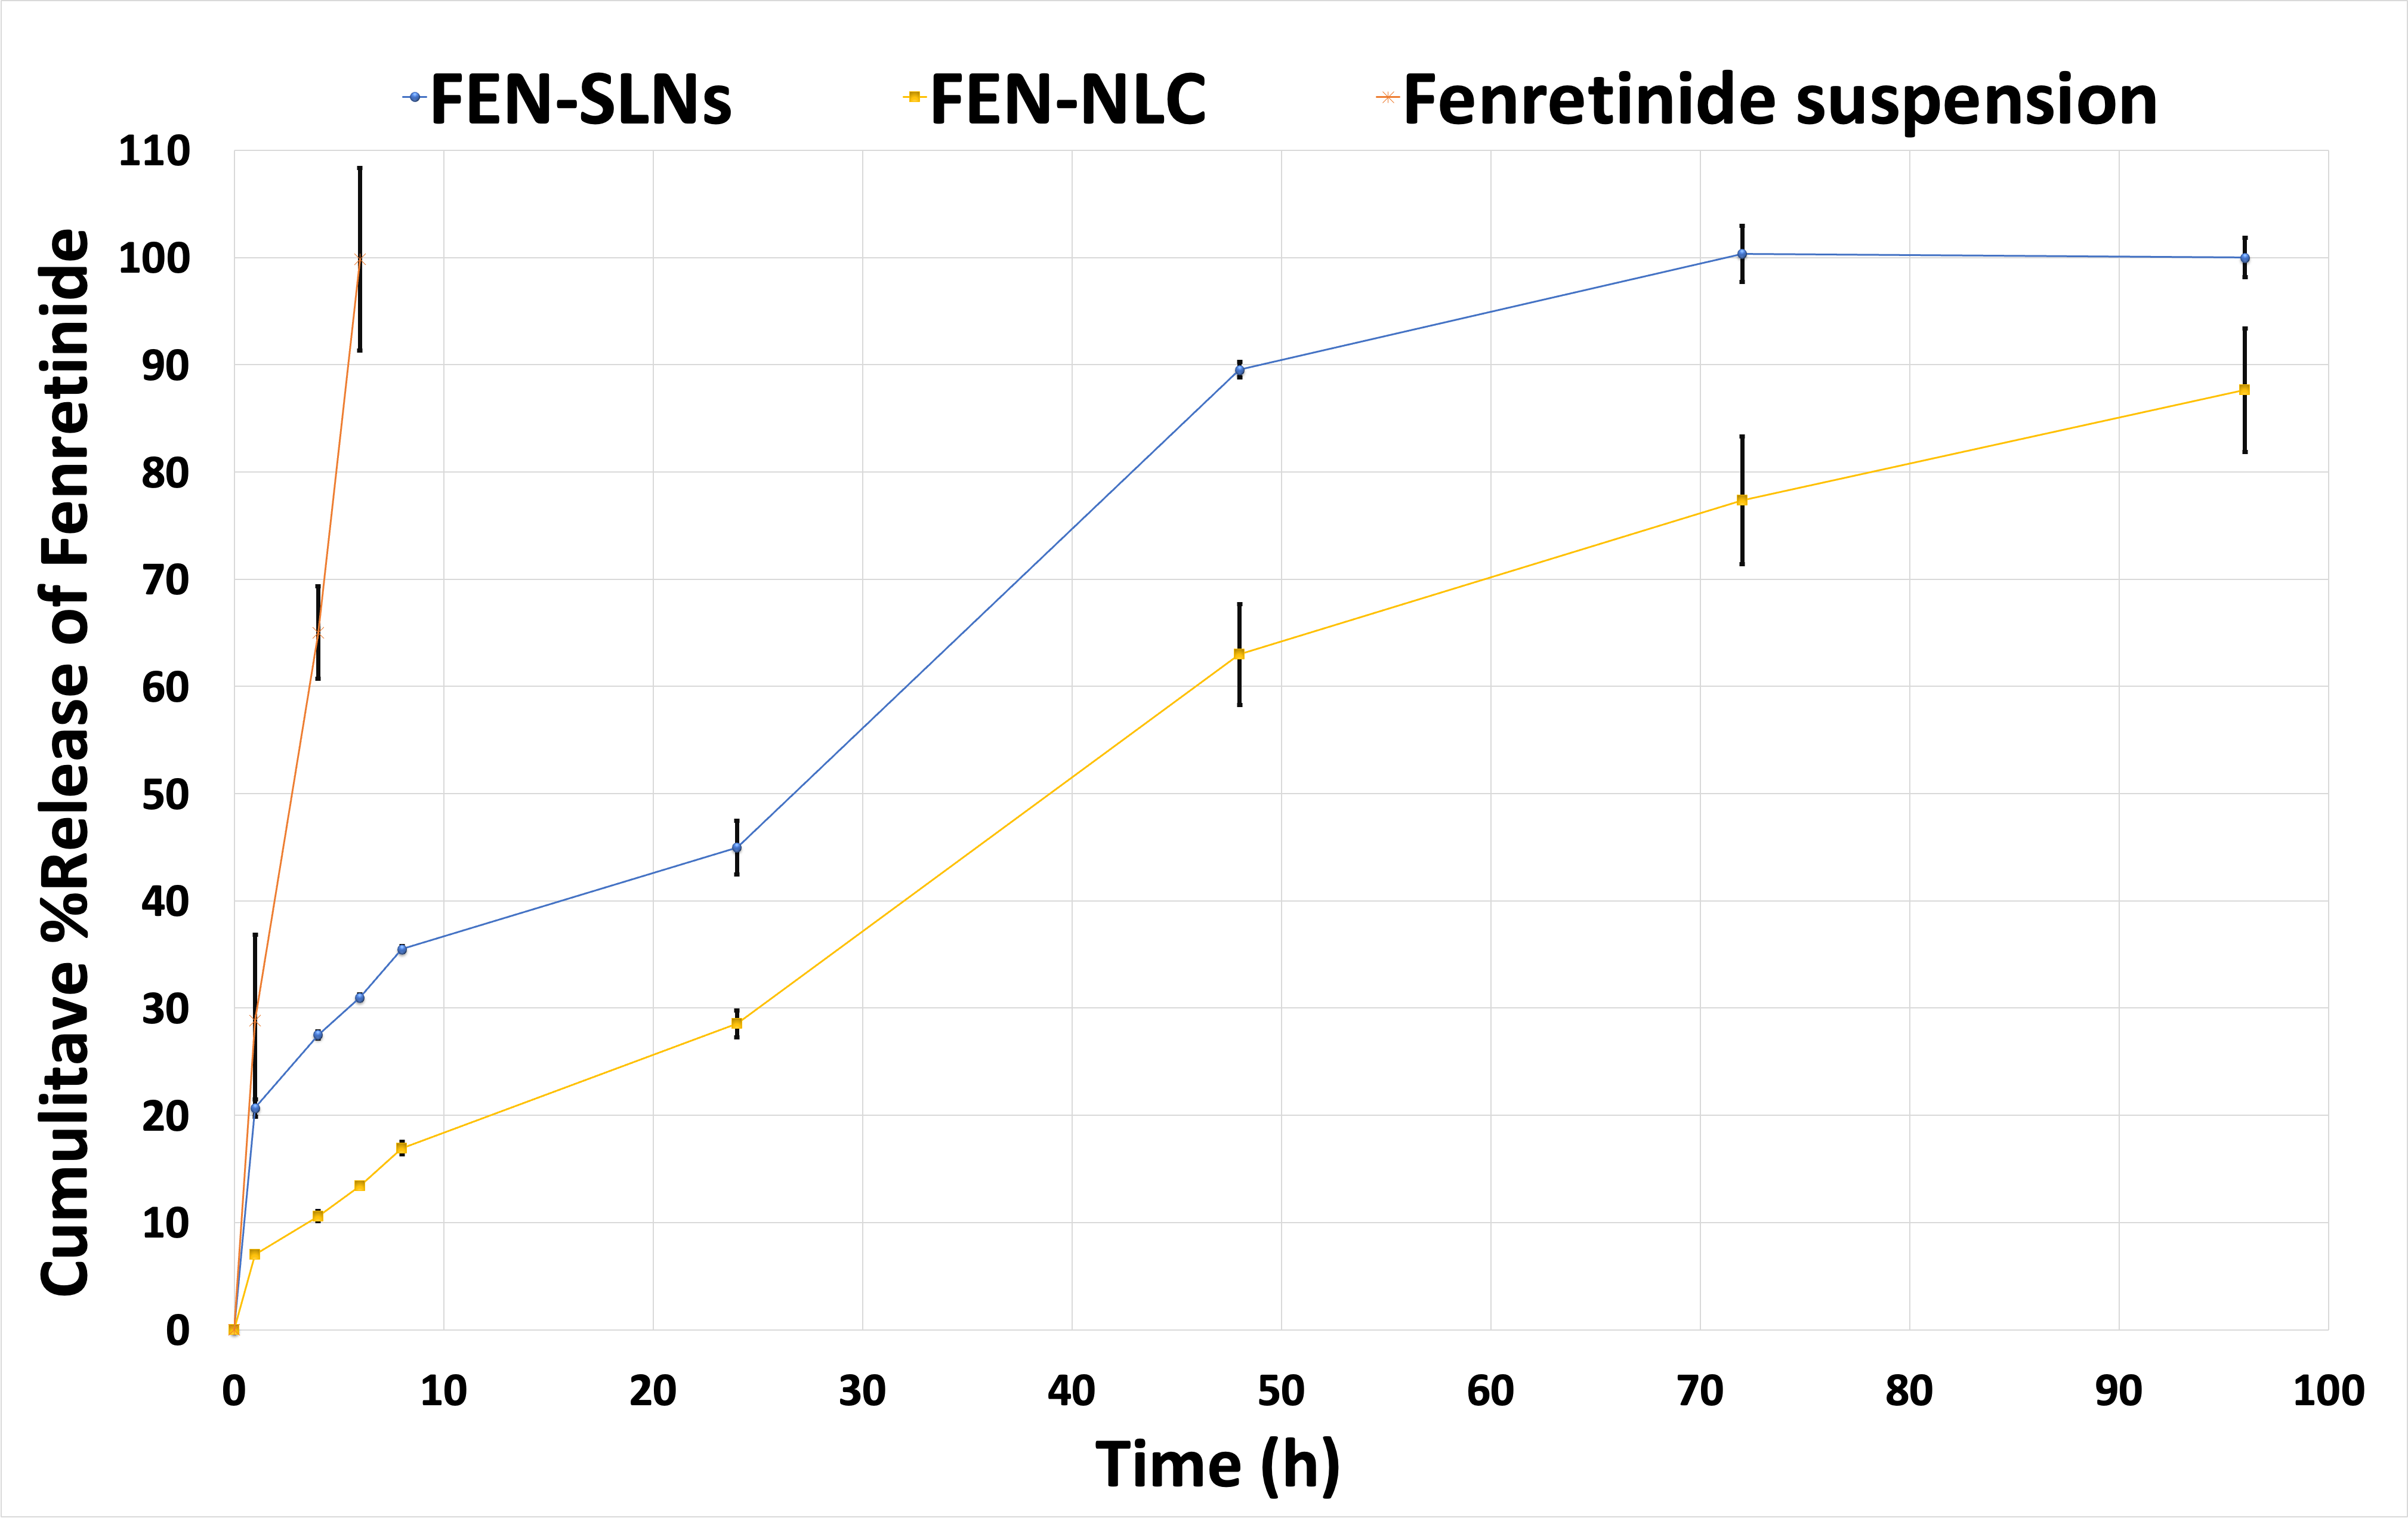
3.6. In vitro drug release
In our previous study [9], the release study was performed for 24h to assess the rate of drug release from FEN-SLNs versus the free drug. It was revealed that, the former showed 40% drug release after 24h in comparison to 100% drug release from the latter after 8h. In this study, a 96h release study was carried out to observe the difference in the release pattern of FEN from FEN-SLNs and FEN-NLCs correlate to drug suspension. It was depicted that there is a noticeable decrease in the release behavior of FEN from the FEN-NLCs.
This could be due to the entrapment of FEN in the lipid core of the nanoparticles. On the other hand, the FEN-SLNs showed an initial burst effect after 2h followed by a steady release pattern similar to the NLCs, confirming the presence of the drug on the surface (Figure 3).
3.7. Cytotoxic activity determination assay (IC50)
The cytotoxicity activity of all formulas and free drug on HepG2 cell line were measured by determining IC50 values which showed that all tested formulas (Free drug, FEN-SLNs and FEN-NLCs were having cytotoxic effects against HepG2 cell line (Figure 4). FEN-SLNs showed the best cytotoxic activity against HepG2 cell line (IC50= 4.7 µg/mL) as shown in table 3. Which is considered an enhance in anticancer effect by 2.5 folds than free drug. On the other hand, FEN-NLCs did not show promising enhancement in anti-cancer activity compared to free FEN. This might be due to entrapment of drug in the core and according to the previously mentioned drug release profile in section 3.7, it required more than 48 h for FEN to release from NLCs. Therefore, FEN-SLNs proved to be a better candidate that can be used for management of liver cancer.
Table 3: IC50 values ((µg/mL) of SLNs and NLCs on HepG2 cells after 48 h.
|
|
HepG2 Hepatocellular carcinoma |
|
IC50 µg/mL |
|
|
Free FEN |
13.1 |
|
FEN-SLNs |
4.7 |
|
FEN-NLCs |
16 |

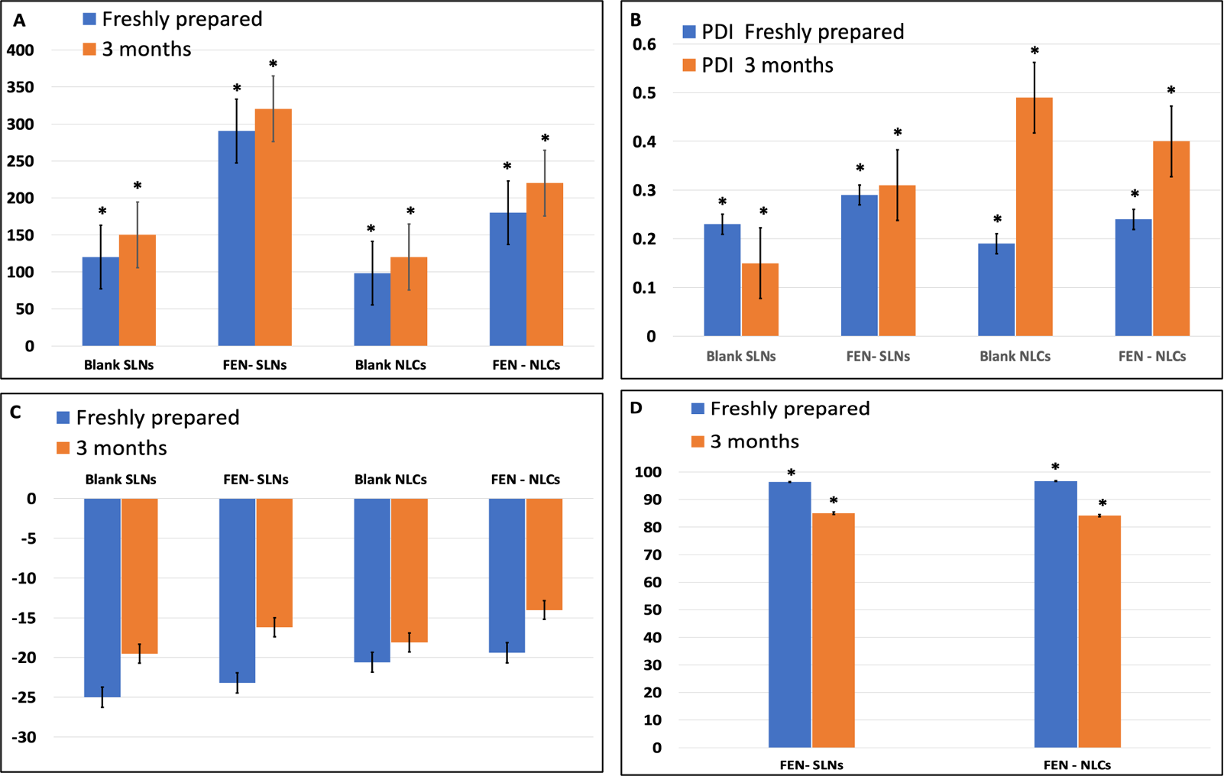
3.8. Stability studies
The charts below demonstrate a significant increase in particle size (p-value<0.05) in both nano systems after three months of storage. Further, Entrapment efficiency presented significant decrease in percentage (p ≤ 0.05) when assessed after storage. In addition, there was no significant difference in Zeta potential after the 3 months period.
4. Conclusion
Both nano systems have good physicochemical properties, with good entrapment efficiency. However, NLCs double the drug loading capacity of SLNs, which can be interpreted by the addition of Miglyol. This addition had entrapped the drug into the core of NLCs as opposed to SLNs where the drug is loaded onto its surface. However, the MTT results showed decreased activity from the previous as opposed to the latter. Further, in vitro release experiment, SLNs showed burst release fortifying the hypothesis of FEN being loaded onto the SLNs surface.
To conclude, although SLNs have lower drug concentration, it has better release behaviour and MTT activity. As a result, further research is needed to increase the drug loading capacity of SLN system.
References
[1] J. Bruix and J. M. Llovet, "Major achievements in hepatocellular carcinoma," The Lancet, vol. 373, no. 9664, pp. 614-616, 2009. View Article
[2] Z. Xu et al., "The performance of docetaxel-loaded solid lipid nanoparticles targeted to hepatocellular carcinoma," Biomaterials, vol. 30, no. 2, pp. 226-232, 2009. View Article
[3] W. U. Xingzhong, H. LU, L. A. N. Zhou, Y. HUANG, and H. CHEN, "Changes of phosphatidylcholine-specific phospholipase C in hepatocarcinogenesis and in the proliferation and differentiation of rat liver cancer cells," Cell Biol Int, vol. 21, no. 6, pp. 375-381, 1997. View Article
[4] J. P. Cooper, C. P. Reynolds, H. Cho, and M. H. Kang, "Clinical development of fenretinide as an antineoplastic drug: Pharmacology perspectives," Exp Biol Med, vol. 242, no. 11, pp. 1178-1184, 2017.
[5] N. Hail, H. J. and Kim, and R. Lotan, "Mechanisms of fenretinide-induced apoptosis," Apoptosis, vol. 11, pp. 1677-1694, 2006. View Article
[6] A. C. Apolinário et al., "Exploring the benefits of nanotechnology for cancer drugs in different stages of the drug development pipeline," Nanomedicine, vol. 15, no. 26. Future Medicine, pp. 2539-2542, 2020. View Article
[7] E. Acosta, "Bioavailability of nanoparticles in nutrient and nutraceutical delivery," Curr Opin Colloid Interface Sci, vol. 14, no. 1, pp. 3-15, 2009. View Article
[8] P. Severino et al., "Current state-of-art and new trends on lipid nanoparticles (SLN and NLC) for oral drug delivery," J Drug Deliv, vol. 2012, 2012. View Article
[9] D. M. Gaber, M. Gayed, and N. Borae, "Formulation, Optimization, and Invitro Characterization of Lipid-Based Nanoparticles for Effective Delivery to the Liver".
[10] N. Nafee, D. M. Gaber, A. O. Elzoghby, M. W. Helmy, and O. Y. Abdallah, "Promoted Antitumor Activity of Myricetin against Lung Carcinoma Via Nanoencapsulated Phospholipid Complex in Respirable Microparticles," Pharm Res, vol. 37, no. 82, pp. 1-24, 2020. View Article
[11] D. M. Gaber, N. Nafee, and O. Y. Abdallah, "Myricetin solid lipid nanoparticles: Stability assurance from system preparation to site of action," Eur J Pharm Sci, vol. 109, no. May, pp. 569-580, 2017, doi: 10.1016/j.ejps.2017.08.007. View Article
[12] M. Mohammadi, A. Pezeshki, M. M. Abbasi, B. Ghanbarzadeh, and H. Hamishehkar, "Vitamin D3-loaded nanostructured lipid carriers as a potential approach for fortifying food beverages; in vitro and in vivo evaluation," Adv Pharm Bull, vol. 7, no. 1, p. 61, 2017. View Article
[13] V. Jenning, M. Schäfer-Korting, and S. Gohla, "Vitamin A-loaded solid lipid nanoparticles for topical use: drug release properties," Journal of controlled release, vol. 66, no. 2-3, pp. 115-126, 2000. View Article