International Journal of Theoretical and Applied Nanotechnology (IJTAN)
ISSN: 1929-1248

Volume 5 - Year 2017 - Pages 27-35
DOI: 10.11159/ijtan.2017.004
Optimization of Micromagnetic Separation for Bacteremia Treatment
Stephen Petty Valenzuela, Sinead Miller, Charleson Bell, Todd Giorgio
Department of Biomedical Engineering, Vanderbilt University
Nashville, TN, USA
Stephen.n.petty.valenzuela@vanderbilt.edu; Sinead.e.miller@vanderbilt.edu;
C.s.bell@vanderbilt.edu; Todd.d.giorgio@vanderbilt.edu
Abstract - Bacteremia and related syndromes such as sepsis and septic shock are becoming an increasing health concern due in large part to the rise of antibiotic resistance and unmet challenges for rapid diagnosis. Extracorporeal bacterial separation methods are currently under development to identify pathogens and reduce bacterial load. Previous studies have generated models to understand the progression of bacteremia. Here, a physiologically-based pharmacokinetic model was integrated with a physically-based magnetic separation model to inform the design of a micromagnetic separation device. This modeling demonstrates that small-footprint microfluidic devices are not efficient enough for bacteremia treatment in large living systems and further research into high-throughput extracorporeal blood-cleansing devices is required.
Keywords: Bacteremia, sepsis, magnetic separation, optimization, modeling
© Copyright 2017 Authors - This is an Open Access article published under the Creative Commons Attribution License terms. Unrestricted use, distribution, and reproduction in any medium are permitted, provided the original work is properly cited.
Date Received: 2017-05-31
Date Accepted: 2017-10-05
Date Published: 2017-12-01
Nomenclature
- A: vector potential
- A: channel cross sectional area
- B: flux density
- B: blood compartment
- b: concentration of microspheres
- b500nm: concentration of 500 nm microspheres
- ce: empirical constant
 : concentration of bound bacteria
 : initial concentration of bacteria
- E: device compartment
- Fdrag: drag force
- Fmag: magnetophoretic force
- f: fraction of bacteria removed
- Gi: bacterial growth rate
- H: magnetic field
- H: liver compartment
- Hc: magnetic coercivity
- h: channel height
- J: current density
- kB: Boltzmann’s constant
- kd: collision rate constant, diffusion
- kshear: collision rate constant, shear
- L: lung compartment
- l: channel length
- m: magnetic separation efficiency
- Nb: number of microspheres per bacterium
- n: number of channels
- pi: partition coefficient
- QE: device volumetric flow rate
- Qi: compartment blood flow rate
- rc: cell radius
- rn: cell-nanoparticle conjugate radius
- S: spleen compartment
- T: temperature
- tinc: incubation time
- tres: residence time in channel
- Vi: blood volume
- w: channel width
- x: binding efficiency
 : shear rate
- µ: magnetic permeability
- µo: vacuum magnetic permeability
- µr: relative magnetic permeability
- η: viscosity
- ρ: fraction of cell surface covered by microspheres
- νmag: magnetophoretic velocity
- χν: volumetric susceptibility
1. Introduction
Bacteremia is defined as the presence of bacteria in the blood, usually from an infection source within a tissue. The systemic immune response syndrome (SIRS) resultant from the bacteria and their endotoxins can progress to life-threatening organ dysfunction, which is known as sepsis [1]–[3]. If not properly addressed, sepsis can quickly advance to include more serious complications, with mortality estimated between 28 and 50 percent [4], [5]. Even after treatment, patients can suffer from sepsis recidivism, recurrent or persistent organ dysfunction, or cognitive and functional impairment [6], [7].
In most developed countries, the incidence of sepsis is estimated to be between 50 and 100 cases per 100,000 people; this incidence is increasing in excess of population growth [5]. Immunocompromised patients – for example, the elderly, neonates, and hospitalized patients – are especially susceptible to bacterial infections. Approximately half of severe sepsis cases occur in patients already in intensive care [8], and these infections are eight times as likely to result in death when compared with other diagnoses [9]. In total, sepsis results in additional annual healthcare costs of more than $17 billion [4].
Given the complexity of the host-pathogen interactions and the number of infectious pathogens, there is no “gold standard” diagnostic or treatment for sepsis. After suspicion of a bacterial infection, broad-spectrum antibiotics are administered, followed by a more specific antibiotic after confirmation of the pathogen. Unfortunately, with each hour effective antibiotic therapy is delayed, survival decreases by 7.6% [10]. Achieving efficacious treatments becomes more difficult as an increasing number of pathogenic bacteria develop resistances to broad spectrum antibiotics, prompting major health organizations to classify combatting antimicrobial resistance as high priority [11], [12].
Effective treatment of bacteremia involves elimination of bacteria at the source of infection. However, migration of bacteria from an initial infection site to other tissues makes treatment increasingly difficult. The lungs, liver, and spleen are tissues of particular interest, since they suffer some of the greatest burdens in bacteremia cases [13]–[17]. The removal of bacteria from the various infected organs can be modeled as a clearance mechanism, lending credence to a multi-compartmental physiologically-based pharmacokinetic (PBPK) model. Several PBPK models of bacterial infection have been developed, one of the first being Cheewatrakoolpong et al.’s two-compartmental murine model [18]. Miller et al. were the first to incorporate an extracorporeal pathogen removal device into an infection model [14]. A magnetic separation model was developed by Kang et al. for their device, interrogating the role of the radius of their magnetic beads in separation efficiency from whole blood [19]. Combining these models allows for better understanding of the pharmacokinetics of extracorporeal pathogen removal via magnetic beads and can inform the selection of bead radius, incubation times, and device flow rates.
Understanding the magnetic field is necessary to calculate the motion and separation of paramagnetic particles. Specifically, the force on paramagnetic particles is directly proportional to the magnetic flux density gradient. The partial differential equations (PDEs) that describe the magnetic field and magnetic flux density cannot be solved analytically if complex geometries are involved, such as multiple magnets. The field of the magnets to be used in the separation device were explored in various configurations to optimize the separation of paramagnetic particles.
2. Methods
2.1. Magnetic Field Modeling
The program FEMM 4.2 was used
to calculate the magnetic field, ![]() , and flux density,
, and flux density, ![]() , of the magnets. The general time-invariant magnetostatic problem has the governing vector equations.
, of the magnets. The general time-invariant magnetostatic problem has the governing vector equations.


where ![]() is the current density. The constitutive equation
is the current density. The constitutive equation

which relates the field to the
flux density by the permeability, ![]() , must be used for
each linear material in the domain. FEMM solves these equations using a
magnetic vector potential approach, defining the magnetic flux density in terms
of a vector potential,
, must be used for
each linear material in the domain. FEMM solves these equations using a
magnetic vector potential approach, defining the magnetic flux density in terms
of a vector potential, ![]() ,
,

This allows the magnetic field governing equation to be rewritten as
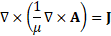
at which point ![]() can be solved for using finite element analysis (FEA).
can be solved for using finite element analysis (FEA). ![]() and
and ![]() can then be derived from
can then be derived from ![]() .
.
Two rectangular
neodymium (NdFeB) magnets (K&J Magnetics, BX04X0, Grade N42 NdFeB, 1"
x 1/4" x 1" thick, relative permeability ![]() , coercivity
, coercivity ![]() ) were simulated and separated by 25mm in an attracting configuration to accommodate the microfluidic channels. The poles of these magnets are located on the thinner sides rather than on the square faces,
making them ideal for a low-profile separator. The flux density field across
the gap in the y-direction was computed and then differentiated in Matlab 2016a
to determine the magnetic flux density gradient,
) were simulated and separated by 25mm in an attracting configuration to accommodate the microfluidic channels. The poles of these magnets are located on the thinner sides rather than on the square faces,
making them ideal for a low-profile separator. The flux density field across
the gap in the y-direction was computed and then differentiated in Matlab 2016a
to determine the magnetic flux density gradient, ![]() .
.
2.2. Magnetic Separation Model
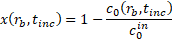
The binding efficiency of particles to A. baumannii was estimated. As discussed by Kang et al. [19], the concentration
of bound bacteria, ![]() , as a function of microsphere radius and incubation time is given
by
, as a function of microsphere radius and incubation time is given
by

where ![]() is the initial concentration of bacteria;
is the initial concentration of bacteria; ![]() is an empirical constant to account for changes in binding efficiency in biologically relevant fluids;
is an empirical constant to account for changes in binding efficiency in biologically relevant fluids; ![]() and
and ![]() are the collision rate constants of diffusion and shear, given respectively by
are the collision rate constants of diffusion and shear, given respectively by


with Boltzmann’s constant, ![]() ; the ambient temperature,
; the ambient temperature, ![]() ; the viscosity of blood,
; the viscosity of blood, ![]() ; the spherical radius of the cell,
; the spherical radius of the cell, ![]() ; the empirically determined shear rate,
; the empirically determined shear rate, ![]() ; and
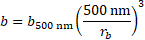
; and ![]() as the incubation time. The concentration of microspheres,
as the incubation time. The concentration of microspheres, ![]() , is calculated
relative to a given concentration of 500 nm microspheres,
, is calculated
relative to a given concentration of 500 nm microspheres, ![]() , by the relation
, by the relation
The overall binding efficiency, ![]() , is therefore calculated as
, is therefore calculated as

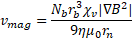
After incubation, the
microspheres and microsphere-bacteria complexes are separated out via the
magnetophoretic force ![]() ,
,
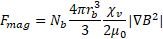
with the constants ![]() , the vacuum magnetic permeability;
, the vacuum magnetic permeability;![]() , the volumetric susceptibility of the microspheres; and
, the volumetric susceptibility of the microspheres; and ![]() , the magnetic flux density gradient.
, the magnetic flux density gradient. ![]() is the number of microspheres bound to a bacterium and is estimated by
is the number of microspheres bound to a bacterium and is estimated by

Here, ![]() refers to the
proportion of the cell surface covered by microspheres.
refers to the
proportion of the cell surface covered by microspheres.
Opposing the
magnetophoretic force is the drag force, ![]() , in terms of the magnetophoretic velocity,
, in terms of the magnetophoretic velocity, ![]() , given by Stokes flow
, given by Stokes flow

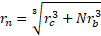
where ![]() is the effective hydraulic radius of a microsphere-bacterium complex given by
is the effective hydraulic radius of a microsphere-bacterium complex given by
Solving ![]() for
for ![]() under the assumption of force equilibrium, the magnetophoretic velocity of the complexes is equal to
under the assumption of force equilibrium, the magnetophoretic velocity of the complexes is equal to
Therefore, the magnetic
separation time across a channel with width ![]() can be calculated as
can be calculated as

Assuming steady
flow in the separation channels, the average velocity of a complex, ![]() , is given by
, is given by

![]() being the volumetric flow rate through the entire device,
being the volumetric flow rate through the entire device, ![]() being the number of channels, and
being the number of channels, and ![]() being the rectangular cross-sectional area of a channel with height
being the rectangular cross-sectional area of a channel with height ![]() and width
and width ![]() . The residence time in the channel,
. The residence time in the channel, ![]() , with length
, with length ![]() can be calculated as
can be calculated as

The magnetic separation efficiency, ![]() , is then estimated by
, is then estimated by
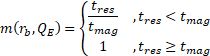
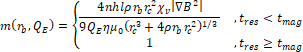
After the
incubation and separation stages, the overall fraction of bacteria removed, ![]() , can be expressed as
, can be expressed as

Table 1 lists the physical constants and parameters used for all of the simulations. The device-specific parameters (width, height, length, and number of channels) are based on a microfluidic design currently in use.
| Parameter | Value and units | Parameter | Value and units |
| 107 CFU/mL | 3.5 | ||
| 3.7 x 10⁻⁴ | 0.5 | ||
| 300 K | 1 x 10⁻⁴ m | ||
| 4.0 x 10⁻³ kg m-1 s-1 | 2 | ||
| 0.5 x 10⁻⁶ m | 5 x 10⁻⁵ m | ||
| 1.0186 s-1 | 2.5 x 10⁻² m | ||
| 0.0025 kg m-3 |
2.2. Physiologically-Based Pharmacokinetic Model
The fractional
magnetic separation from Equation 20 factors into the
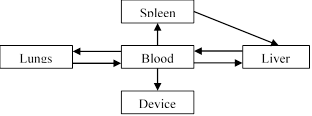
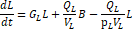
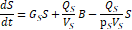
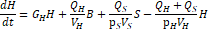
five-compartment PBPK model of infection diagrammed in Figure 1 and detailed in
Equations 23-27. Each physiologic compartment has its own associated growth
rate, ![]() , blood volume,
, blood volume, ![]() , blood flow rate,
, blood flow rate, ![]() , and partition coefficient to bacteria,
, and partition coefficient to bacteria, ![]() (Table 2). The arrows in Figure 1 represent the transport of bacteria between compartments. The blood of the systemic circulation flows to and from each of the organs, except notably where blood is transported from the spleen to the liver via the portal vein. Additionally, the most significant modification from the model published by Miller et al. [14] is the removal of the return pathway from the device to the blood. Here, it is assumed that any
bacteria captured have no path of reentry into the circulatory system;
consequently, uncaptured bacteria remain in the blood compartment.
(Table 2). The arrows in Figure 1 represent the transport of bacteria between compartments. The blood of the systemic circulation flows to and from each of the organs, except notably where blood is transported from the spleen to the liver via the portal vein. Additionally, the most significant modification from the model published by Miller et al. [14] is the removal of the return pathway from the device to the blood. Here, it is assumed that any
bacteria captured have no path of reentry into the circulatory system;
consequently, uncaptured bacteria remain in the blood compartment.

Six different infection and treatment scenarios were then simulated using the coupled differential equations. First, a non-immunocompromised human, an immunocompromised
(neutropenic) human, and an immunocompromised human with antibiotic
administration were simulated. These three scenarios were then simulated again
with the extracorporeal device. A simulated bolus of 107 CFU/mL of A. baumannii was injected into the lung compartment and allowed to proliferate
in the system for ten hours. After incubating the blood with the colistinated
magnetic microspheres for ![]() 5 min, the extracorporeal device was linked into the system and was
run for 96 hours. Matlab 2016a’s 4th-order Runge-Kutta differential
equation solver was used to calculate an approximate solution to the system of
differential equations. To determine the efficacy of treatment, the area under
the curve (AUC) in each of the compartments, computed via trapezoidal
integration, was compared across flow rates and microsphere radii. As a quantifiable
criterion, the time to go below a threshold of 1 CFU/mL in the bloodstream was
also examined [14].
5 min, the extracorporeal device was linked into the system and was
run for 96 hours. Matlab 2016a’s 4th-order Runge-Kutta differential
equation solver was used to calculate an approximate solution to the system of
differential equations. To determine the efficacy of treatment, the area under
the curve (AUC) in each of the compartments, computed via trapezoidal
integration, was compared across flow rates and microsphere radii. As a quantifiable
criterion, the time to go below a threshold of 1 CFU/mL in the bloodstream was
also examined [14].
Table 2. Parameters
for PBPK model of A. baumannii infection by compartment as given by
Miller et al. [14]. N = normal, IC
= immunocompromised, AB = antibiotic + IC. Flow rate measured in m3
h-1, volume measured in m3, growth rate is measured in h-1, and the partition coefficient is dimensionless. ![]() is varied.
is varied.
| N | IC | N | IC | AB | |||
| L | 0.090 | 4.50 x 10⁻⁴ | 93 | 3 | -1.74 | 0.21 | -0.24 |
| S | 0.015 | 2.09 x 10⁻⁴ | 59 | 28 | -0.14 | 0.14 | -0.07 |
| H | 0.048 | 1.56 x 10⁻³ | 749 | 79 | -0.10 | 0.10 | -0.18 |
| B | N/A | N/A | N/A | N/A | -0.17 | 0.08 | -0.05 |
| E | 2.5 x 10⁻¹⁰ | 1 | 1 | N/A | N/A | N/A | |
3. Results and Discussion
>3.1. Magnetic Field Modeling
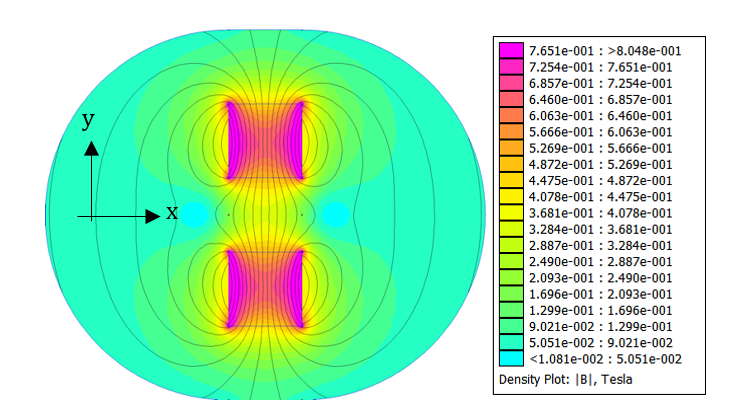
The domain around two rectangular NdFeB magnets was simulated via FEA with 4574 nodes and 8721 elements. The calculated two-dimensional magnetic flux density is consistent with the manufacturer’s documentation for a single magnet (Figure 2) [20]. Maximum flux density occurs inside the magnets along the edges parallel to the poles, while the magnetic field lines towards the boundary of the simulation loop from the north pole of one magnet to the south pole of the other. Similarly, the magnetic field lines connect the closest poles of the two magnets and approach being parallel.
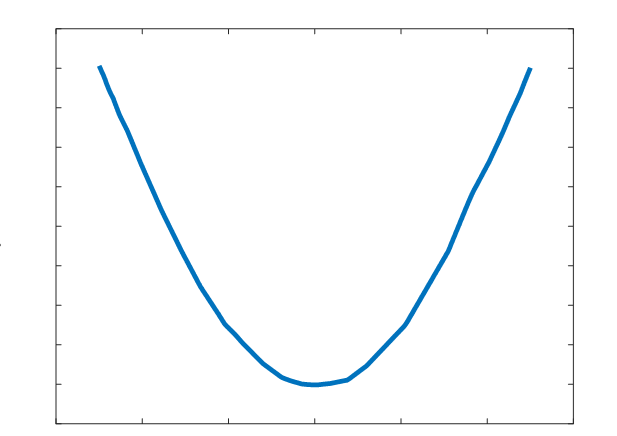
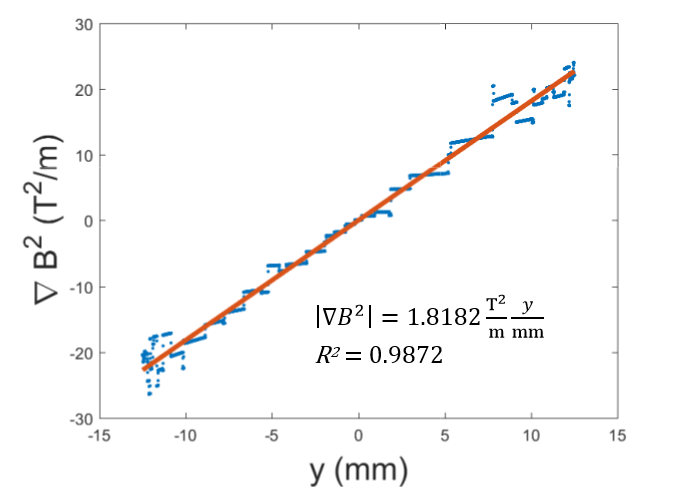
A parabolic profile with a maximum flux density of 0.521T and a minimum field strength of 0.360T was achieved across the channel (Figure 3). Differentiating this with respect to position, the magnetic flux density gradient is approximately linear and ranges from approximately -20 T2/m to 20 T2/m (Figure 4). At the location of the microfluidic channels, 2.1mm from the center of the space between the magnets, the magnetic flux density gradient was estimated to be 4.7 T2/m. With this magnetic flux field, a linear magnetic flux density gradient can be established to ensure consistent separation of magnetic complexes. Furthermore, the magnetic flux density gradient can be tuned to increase separation efficiency.
3.2. Physiologically-Based Pharmacokinetic Model with Magnetic Separation
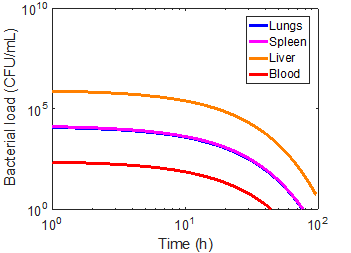
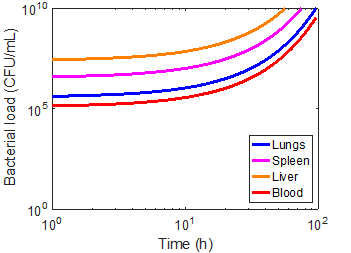
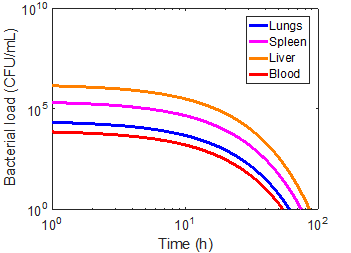
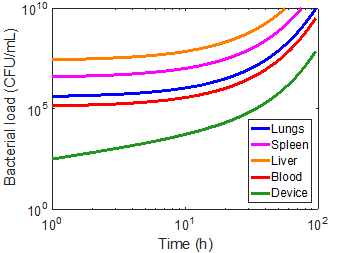
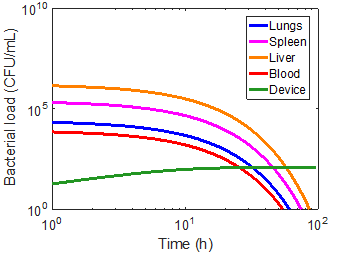
Using the magnetic flux density gradient from the magnetostatic simulation, the magnetic separation of microsphere-bacteria complexes was modeled in conjunction with the infection model. The pharmacokinetic profiles of infection can be seen in the three cases in Figures 5-7. The blood bacterial load decreases to 1 CFU/mL in approximately 44.17 h for the immunonormal case, with the rest of the compartments taking longer to clear the bacteria; in fact, the liver does not reach the threshold within the simulated 96 hours (Figure 5). Nevertheless, based on the trend of decreasing bacterial concentrations, the liver should be able to clear the remaining bacteria in a reasonable amount of time. In the immunocompromised case, bacterial concentrations in all compartments continue increasing to lethal limits of 1010 CFU/mL (Figure 6). Upon administration of effective antibiotics, the kinetics curves follow a similar trajectory to the immunonormal case (Figure 7). The blood and spleen compartments take on an additional bacterial burden relative to the immunonormal case, suggesting that additional care should be taken to ensure minimal toxicity in these compartments.
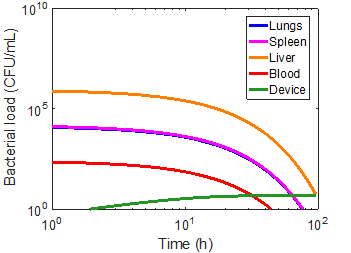
As a first approximation, a bead radius of 75 nm and a flow rate of 0.1 mL/min was used in the simulation. Applying the device to each of the immune cases did manage to capture a significant number of bacteria, but had virtually no impact on the overall infection kinetics (Figures 8-10). In the first ten hours of the immunocompromised scenario, the bacteria load of the device increased at a greater rate than in any of the other compartments. As the extracorporeal treatment progressed, bacterial loads in the body began to increase at a similar rate as in the device (Figure 10).
The amount of bacteria captured in the device is heavily dependent on the bacterial load of the blood compartment, as can be seen by comparing the immunonormal and antibiotic administration case. With a lower bacterial load in the immunonormal scenario, the device does not begin to capture bacteria until approximately the 2-hr mark (Figure 8), whereas the device shows significant capture within the first hour in the case of antibiotic administration (Figure 9). Thus, it may be prudent to reserve an efficacious extracorporeal separation for severe cases of bacteremia, where blood bacterial loads are higher, and omit the treatment for immunonormal treatments.
A grid search of the parameter space for bead radii from 25 nm to 500 nm and flow rates from 0.01-1.5 mL/min was employed to find any minimizers. No combination of bead radius and flow rate in this domain was found to significantly impact any of the infection metrics; standard deviations of any given metric across the space were more than two orders of magnitude less than the mean (Tables 3-5). Since the impact of the devices is so small, it is difficult to determine a meaningful minimizer with this method. Thus, any device with similar specifications would most likely not be able to treat a patient with bacteremia. An expanded search, especially with additional variables, could yield more meaningful minimizers. However, it must be noted that, due to the computational burden imposed by the differential equation solver, an efficient optimization algorithm must be used, such as the Nelder-Mead algorithm.
Table 3. Maximum bacterial load (CFU/mL) in the compartments across microsphere radius and flow rate parameter space. Mean ± standard deviation. N = normal, IC = immunocompromised, AB = antibiotic + IC.
| N | IC | AB | |
| L | 1.32 x 10⁴ ± 6.82 x 10⁻¹⁰ | 1.02 x 10¹⁰ ± 5.36 x 10⁷ | 2.48 x 10⁴ ± 5.71 x 10⁻¹⁰ |
| S | 1.45 x 10⁴ ± 4.02 x 10⁻¹⁰ | 9.61 x 10¹⁰ ± 5.04 x 10⁷ | 2.41 x 10⁵ ± 4.83 x 10⁻⁹ |
| H | 8.66 x 10⁵ ± 5.47 x 10⁻⁹ | 6.76 x 10¹¹ ± 3.48 x 10⁹ | 1.66 x 10⁴ ± 5.26 x 10⁻¹⁰ |
| B | 2.49 x 10² ± 2.63 x 10⁻² | 3.39 x 10⁹ ± 1.78 x 10⁷ | 8.27 x 10³ ± 1.55 x 10⁻¹⁰ |
Table 4. Time (h) to reach a threshold of 1 CFU/mL in the compartments across microsphere radius and flow rate parameter space. Mean ± standard deviation. N = normal, IC = immunocompromised, AB = antibiotic + IC.
| N | IC | AB | |
| L | 75.97 ± 0.001 | N/A | 60.76 ± 0.02 |
| S | 76.72 ± 0.002 | N/A | 74.41 ± 0.03 |
| H | N/A | N/A | 86.00 ± 0.03 |
| B | 44.17 ± 0.004 | N/A | 54.17 ± 0.02 |
Table 5. AUC (CFU/mL * h) in the compartments across microsphere radius and flow rate parameter space. Mean ± standard deviation. N = normal, IC = immunocompromised, AB = antibiotic + IC.
| N | IC | AB | |
| L | 1.06 x 10⁵ ± 8.09 x 100 | 9.58 x 10¹⁰ ± 4.57 x 10⁸ | 1.49 x 10⁵ ± 6.44 x 101 |
| S | 1.16 x 10⁵ ± 8.33 x 100 | 9.04 x 10¹¹ ± 4.29 x 10⁹ | 1.44 x 10⁶ ± 5.87 x 10² |
| H | 6.93 x 10⁶ ± 9.73 x 101 | 6.36 x 10¹² ± 2.96 x 10¹⁰ | 9.94 x 10⁶ ± 3.13 x 10³ |
| B | 1.99 x 10³ ± 1.57 x 10⁻¹ | 3.19 x 10¹⁰ ± 1.52 x 10⁸ | 4.96 x 10⁴ ± 2.15 x 101 |
By examining the equations
used in the magnetic separation and infection models, some insights can be
gained as to why magnetic separation may not be wholly feasible as a treatment
mechanism. In the binding efficiency equation, ![]() has a major impact. Physiologically speaking,
has a major impact. Physiologically speaking, ![]() is related to the density of particles in the fluid; that is to say, the blood cells that are already present interfere with the binding of the
magnetic beads to the bacterial cells. Therefore, as
is related to the density of particles in the fluid; that is to say, the blood cells that are already present interfere with the binding of the
magnetic beads to the bacterial cells. Therefore, as ![]() decreases, the overall binding efficiency,
decreases, the overall binding efficiency, ![]() , goes to zero. If
the major blood components were to be removed before magnetophoretic
separation, the constant
, goes to zero. If
the major blood components were to be removed before magnetophoretic
separation, the constant ![]() would increase. However, this somewhat defeats the purpose of a magnetophoretic separation system.
would increase. However, this somewhat defeats the purpose of a magnetophoretic separation system.
With the magnetophoretic
separation efficiency, both the bead radius, ![]() , and the bacterial radius,
, and the bacterial radius, ![]() , have profound influence. Reducing the equation for the magnetophoretic force,
, have profound influence. Reducing the equation for the magnetophoretic force, ![]() , shows that the force depends linearly on the bead radius, but quadratically on the bacterial radius. This dependence arises from the fact
that the available surface area of a bacterium increases with the square of the
radius. This dependence on bacterial radius carries over to the magnetic
separation efficiency,
, shows that the force depends linearly on the bead radius, but quadratically on the bacterial radius. This dependence arises from the fact
that the available surface area of a bacterium increases with the square of the
radius. This dependence on bacterial radius carries over to the magnetic
separation efficiency, ![]() , but is less straightforward due to the impact of the hydraulic radius term,
, but is less straightforward due to the impact of the hydraulic radius term, ![]() . The strong influence of the bacterial radius, therefore, cannot be ignored when developing a magnetic separation system. Additionally, the
model may also be limited by the assumption of a spherical cell, while bacteria
have a variety of shapes that could allow for more binding surface area than is
accounted for.
. The strong influence of the bacterial radius, therefore, cannot be ignored when developing a magnetic separation system. Additionally, the
model may also be limited by the assumption of a spherical cell, while bacteria
have a variety of shapes that could allow for more binding surface area than is
accounted for.
Mechanical and
biomechanical constraints of the microfluidic device were not incorporated into
this model, but may restrict separation efficiency further. Although a creeping
flow (![]() would increase the magnetic separation efficiency, such a flow
would reduce the rate of change of bacterial load in the device and render it
ineffective in clearing bacteria. The flow rate of blood through an
extracorporeal separator has upper limits. Pressure within the microfluidic
device has to be below the corresponding yield stresses. Additionally, the flow
rate through the device must correspond to physiological flow rates; for
example, the flow rate used in kidney dialysis has been proposed.
would increase the magnetic separation efficiency, such a flow
would reduce the rate of change of bacterial load in the device and render it
ineffective in clearing bacteria. The flow rate of blood through an
extracorporeal separator has upper limits. Pressure within the microfluidic
device has to be below the corresponding yield stresses. Additionally, the flow
rate through the device must correspond to physiological flow rates; for
example, the flow rate used in kidney dialysis has been proposed.
4. Conclusion
Incorporating a physically-based magnetic separation efficiency model into a physiologically-based pharmacokinetic model allows for a better understanding of the efficacy of a magnetics-based extracorporeal separation device. Here, it is demonstrated that with conventional magnets and microfluidics, clinical outcomes would most likely not improve, since bacterial load metrics were not significantly changed by any change to the microsphere radius or device flow rate. High-throughput, high-capture devices will be essential for there to be any improvement in patient outcomes.
Acknowledgements
This work was supported by the U.S. Department of Defense under contract W81XWH-13-1-0397, Vanderbilt University School of Engineering, and the Vanderbilt University Undergraduate Summer Research Program (VUSRP).
References
[1] C. W. Seymour, V. X. Liu, T. J. Iwashyna, F. M. Brunkhorst, T. D. Rea, A. Scherag, G. Rubenfeld, J. M. Kahn, M. Shankar-Hari, M. Singer, C. S. Deutschman, G. J. Escobar, and D. C. Angus, “Assessment of Clinical Criteria for Sepsis: For the Third International Consensus Definitions for Sepsis and Septic Shock (Sepsis-3),” Jama, vol. 315, no. 8, pp. 762–74, 2016. View Article
[2] I. László, D. Trásy, Z. Molnár, and J. Fazakas, “Sepsis : From Pathophysiology to Individualized Patient Care,” Journal of Immunology Research, vol. 2015, 2015. View Article
[3] J. L. Vincent, S. M. Opal, J. C. Marshall, and K. J. Tracey, “Sepsis definitions: Time for change,” The Lancet, vol. 381, no. 9868, pp. 774–775, 2013. View Article
[4] D. C. Angus, W. T. Linde-Zwirble, J. Lidicker, G. Clermont, J. Carcillo, and M. R. Pinsky, “Epidemiology of severe sepsis in the United States: analysis of incidence, outcome, and associated costs of care,” Critical care medicine, vol. 29, no. 7, pp. 1303–1310, 2001. View Article
[5] G. S. Martin, “Sepsis, severe sepsis and septic shock: changes in incidence, pathogens and outcomes,” Expert Rev Anti Infect Ther, vol. 10, no. 6, pp. 701–706, 2012. View Article
[6] F. W. Guirgis, S. Brakenridge, S. Sutchu, J. D. Khadpe, T. Robinson, R. Westenbarger, S. T. Topp, C. J. Kalynych, J. Reynolds, S. Dodani, F. A. Moore, and A. E. Jones, “The long-term burden of severe sepsis and septic shock,” Journal of Trauma and Acute Care Surgery, vol. 81, no. 3, p. 1, 2016. View Article
[7] T. J. Iwashyna, E. W. Ely, D. M. Smith, and K. M. Langa, “Long-term Cognitive Impairment and Functional Disability Among Survivors of Severe Sepsis,” Jama-Journal of the American Medical Association, vol. 304, no. 16, pp. 1787–1794, 2010. View Article
[8] F. B. Mayr, S. Yende, and D. C. Angus, “Epidemiology of severe sepsis.,” Virulence, vol. 5, no. 1, pp. 4–11, 2014. View Article
[9] M. J. Hall, S. N. Williams, C. J. DeFrances, and A. Golosinskiy, “Inpatient care for septicemia or sepsis: a challenge for patients and hospitals,” NCHS data brief, no. 62, pp. 1–8, 2011.
[10] A. Kumar, D. Roberts, K. E. Wood, B. Light, J. E. Parrillo, S. Sharma, R. Suppes, D. Feinstein, S. Zanotti, L. Taiberg, D. Gurka, A. Kumar, and M. Cheang, “Duration of hypotension before initiation of effective antimicrobial therapy is the critical determinant of survival in human septic shock,” Crit Care Med., vol. 34, no. 0090–3493 (Print), pp. 1589–1596, 2006. View Article
[11] CDC, “Antibiotic resistance threats in the United States, 2013,” Current, p. 114, 2013.
[12] World Health Organization, “The evolving threat of antimicrobial resistance: Options for action,” WHO Publications, pp. 1–119, 2014.
[13] K. Yuki and N. Murakami, “Sepsis pathophysiology and anesthetic consideration.,” Cardiovascular & hematological disorders drug targets, vol. 15, no. 1, pp. 57–69, 2015. View Article
[14] S. E. Miller, C. S. Bell, M. S. Mcclain, T. L. Cover, and T. D. Giorgio, “Dynamic Computational Model of Symptomatic Bacteremia to Inform Bacterial Separation Treatment Requirements,” PLOS ONE, vol. 11, no. 9, pp. 1–22, 2016. View Article
[15] R. S. Munford, “SEVERE SEPSIS AND SEPTIC SHOCK: The Role of Gram-Negative Bacteremia,” Annual Review of Pathology: Mechanisms of Disease, vol. 1, no. 1, pp. 467–496, 2006. View Article
[16] O. Cirioni, C. Silvestri, R. Ghiselli, F. Orlando, A. Riva, E. Gabrielli, F. Mocchegiani, N. Cianforlini, M. Michela, C. Trombettoni, V. Saba, G. Scalise, and A. Giacometti, “Therapeutic efficacy of buforin II and rifampin in a rat model of Acinetobacter baumannii sepsis,” Critical care medicine, vol. 37, no. 4, pp. 1403–1407, 2009. View Article
[17] J. D. Faix, “Biomarkers of sepsis,” vol. 8363, no. 1, pp. 23–36, 2013.
[18] B. Cheewatrakoolpong, E. K. Steffen, R. Don Brown, and R. D. Berg, “Kinetic analysis of bacterial clearance in mice using the ESTRIPc and KINET microcomputer programs,” Journal of Immunological Methods, vol. 58, no. 3, pp. 375–381, 1983. View Article
[19] J. H. Kang, E. Um, A. Diaz, H. Driscoll, M. J. Rodas, K. Domansky, A. L. Watters, M. Super, H. A. Stone, and D. E. Ingber, “Optimization of Pathogen Capture in Flowing Fluids with Magnetic Nanoparticles,” Small, vol. 11, no. 42, pp. 5657–5666, 2015. View Article
[20] K&J Magnetics, K&J Magnetics - BX04X0 Magnetic Field Visualization. [Online]. Available: https://www.kjmagnetics.com/magfield.asp?pName=BX04X0. [Accessed: 20-Sep-2017].