International Journal of Theoretical and Applied Nanotechnology (IJTAN)
ISSN: 1929-1248

Volume 5 - Year 2017 - Pages 8-19
DOI: 10.11159/ijtan.2017.002
Information at Sub-Micro and Nano in an Alloy by Small Angle X-ray Scattering and X-ray Diffraction
Yi Zheng
Powder Metallurgy Institute, Central Iron Steel Research Institute
No. 76 Xueyuan Nanlu, Haidian District, Beijing, China, 100081
zhengyipanlain@163.com
Abstract - The size distribution of sub-micro-sized and nano-sized γ` precipitates, which were electrolytically extracted from AM3 Single Crystal Supper Alloy, was measured by Small Angle X-ray Scattering and other methods. Lack of size evidence from 100nm to 1 μm, many papers are being published with size from 1 nm to 100 nm about nanoparticles, aren’t be regarded as good enough by SAXS in this paper. There may be some nanoparticles between 100nm to 1μm. The measurement results were analyzed statistically and also compared with the same sample measured by SEM and so on, and the difference between discover and quantification of nanoparticles was discussed. TEM, SEM regarded as discover of nanoparticles, and XRD, SAXS regarded as quantification of nanoparticles were discussed. Ordering phase and disordering phase in γ` precipitates were also quantified by Rietveld method and was also completed with TEM. Lack of statistic reliable information from nano-meter to sub-micrometer, TEM and SEM are not good enough for publishing of a paper about size for nanoparticles. After the discussion, conclusions are completed, TEM, SEM for morphology of nanoparticles, SSA for the mean size of nano powder, SAXS and Laser (usually with awful caking data) for size distribution from nano-meter to sub-micrometer. Meanwhile, conclusion of nano structure in nano-particles, two different results from TEM and XRD, discover and quantification, they are fatal to each other, should be published in one paper for the reason not only accurate but also statistics on nano research in future, was done in this paper. Indeed, that means the measurement of atoms in SCSA blade each by each for Feynman’ lecture even that someone could operate atoms each by each is an impossibility mission over the scale of decimeter or millionmeter until now.
Keywords: Single Crystal Super Alloy, Small Angle X-ray Scattering, nanoparticle, particle size distribution, XRD.
© Copyright 2017 Authors - This is an Open Access article published under the Creative Commons Attribution License terms. Unrestricted use, distribution, and reproduction in any medium are permitted, provided the original work is properly cited.
Date Received: 2016-10-12
Date Accepted: 2017-02-24
Date Published: 2017-09-05
1. Introduction
Properties of metal were determined by its microstructures at sub micro-scale and even nano-scale. As a typical example, the precipitates of γ` with the size from the nano-meters to sub-micro meters play an important role on the property of AM3 Single Crystal Super Alloy (SCSA), which is the material of gas turbine and aircraft engine and often working in fire, a very severe environment. Since Versnyder and Shank suggested the SCSA as an ideal composite material for the engine, its high-temperature property has been gradually improved with the optimized microstructures [1]. All SCSA have a common microstructure of γ´ phase, which is Ni3Al with the structure of L12-ordered FCC and precipitates in the γ phase, the latter is Ni-based matrix with the structure of disordered FCC. The two phases are coherent with a simple cube-cube orientation relationship, i.e. [0 0 1] γ ‖ [0 0 1] γ’ [2]. Many studies have indicated that both the tensile properties and creep strength of SCSA are determined by the size distribution and the sub-microstructure of the γ´ particles [3]. However, the microstructures of SCSA are often evolved during its service life, particularly, such a microstructural evolution mainly result from the change of γ´ precipitates in the ordering, mismatch, particle size and so on, which are often directly observed by SEM and TEM and published extensively in the references. Unfortunately, the popularly employed experimental techniques like SEM, TEM and EBSD are actual for the observation and measurement in a very small field so that their results are quite limited in statistics and even not able to represent the overall characteristics of the studied microstructures. In this paper, millions of both sub-micro-sized and nano-sized γ´ particles in an area of several square milli-meters were measured in a large volume of the SCSA using SAXS. The statistical information from these particles were then derived and summarized. The derived results were also compared with the measured results from the tiny area by SEM, and the difference between them was then discussed. It has no doubt that the results from the statistical measurement on the size distribution of both sub-micro-sized and nano-sized γ´ particles should be very helpful on understanding the losing properties of the AM3 SCSA during its service. However, it is so odd and uncomfortable to publish different data about one thing, γ´ phase, from TEM and X-ray. So, next process in this paper discussed the necessary that nano research should be divided into two branches, discovery and quantification. Meanwhile, all other funny focusing in this paper spread are all from 1nm to less 1micrometer.
2. Experimental
The AM3 sample with the composition Ni- 8.0Cr-5.5Co-2.25Mo-5.0W-6.0Al-2.0Ti-3.5Ta (wt.%), which was provided by High Temperature Resistant Alloy Institute (HTRAI) of Central Iron Steel Institute Research (CISRI), and was the first gap of single crystal super-alloy researched by ONERA in France, working temperature over 900℃ in gas turbine. Three kinds of AM3 Ni-based SCSA samples subjected by different heat treatments were examined, one sample being only cast without further heat treating, the second one with an expansion solution heat treatment at 1080℃ with holding time of 8 hours and cold air quenched to obtain small cuboidal γ´ precipitates after casting, the third one with a furthermore aged treatment at 870℃/20h after the quenching process. For obtaining more stead structure of γ´ precipitates in AM3, the last aged heat treatment ensured that there were new nano-scale secondary γ´ precipitating in the γ channels is a common technology standard of the SCSA heat-treatment. All the measurements in this paper were carried out after these three samples and their two heat treatments. For the necessary property of the measurement to get rid of the necessary residual stress, some of samples were etched before test process.
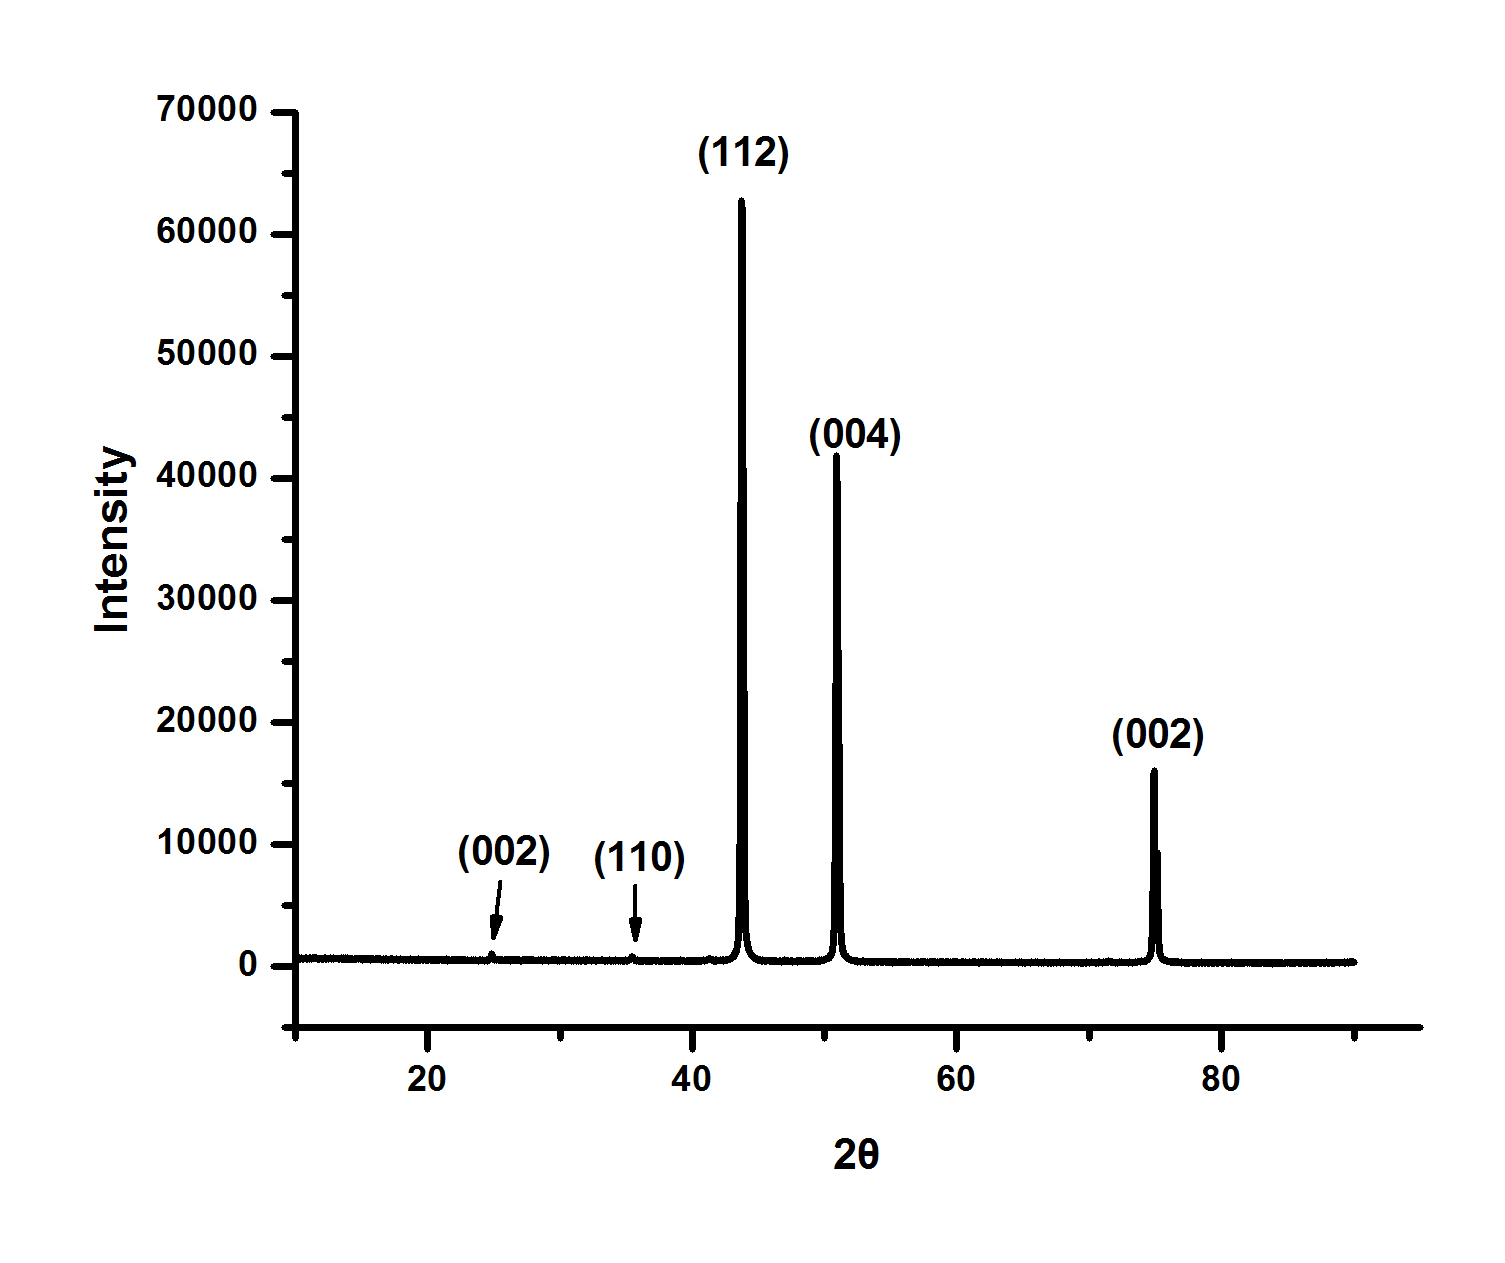
Different phases in SCSA have different electrode potentials. For the reasons of the distribution of Cr in the γ and γ´ phases of SCSA are not equal, the electrode potentials vary between the γ´ phase and the base of Super Alloys, γ phase. It was Kriege who introduced a system using electrochemistry to analyze such Super Alloys [4] and it found that the lattice parameter of γ´ precipitates can be measured accurately via SAXS if the precipitates are extracted from the matrix. An electrolyte with the composition, 10g, (NH4)2SO4-20g Citric acid, 1200ml, H2O, was used in the electrolyze for γ´ precipitates, 5-15 ℃, 0.05-0.45A, 20-50V. A cellulose acetate membrane placed at the bottom of the vessel filtered the ions of the γ phase that had been dissolved in the solution. After washing, desiccation, weighting and dispersing by supersonic, γ´ was been dispersed in the acetone of nitrate cellulose to dry being a measurement film. According the technology standard of ISO/TS 13762 [5] and papers, Small Angle X-ray Scattering had been done on Rigaku 3014 to measure the distribution of particle size of γ´. The equipment with Co radiation was used, Kratky U 10μm×15mm slit, 30kV, 30mA. Meanwhile, powder X-ray diffractometer of Rigaku G/max with Cu Kα radiation source, θ-2θ geometry from 10° to 90° with 0.02°/s angle speed and an 18 kW X-ray generator, 40kV and 200mA, was used to check the phases in all samples. The TREOR program was used to index the diffraction peaks, and searching matched by the program of PDF+4-2009. Phase structures, including changing of structural parameters and atomic occupations were determined by Rietveld method running in DOS by D. B. Wiles and R. A. Young [6] modified and adapted to PC-compatibles by C. U. Segre. Furthermore, the Reciprocal Space Mapping of AM3 SCSA were measured using X-ray diffractometer of PANalytical X’Pert MRD with Cu Kα radiation, 40kV and 40mA to certify the changing in SACA.
3. Result
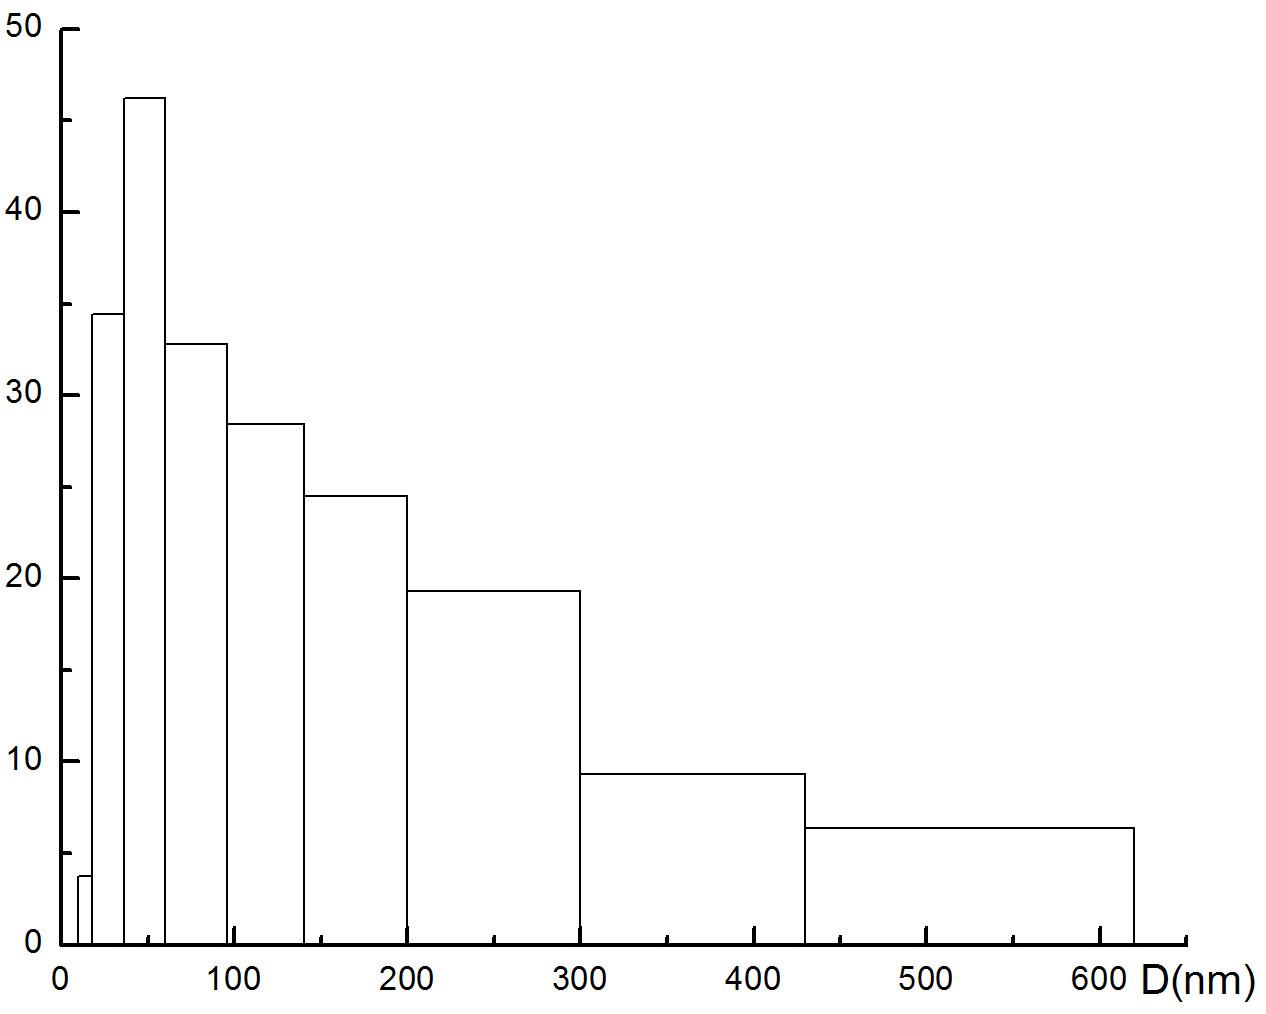
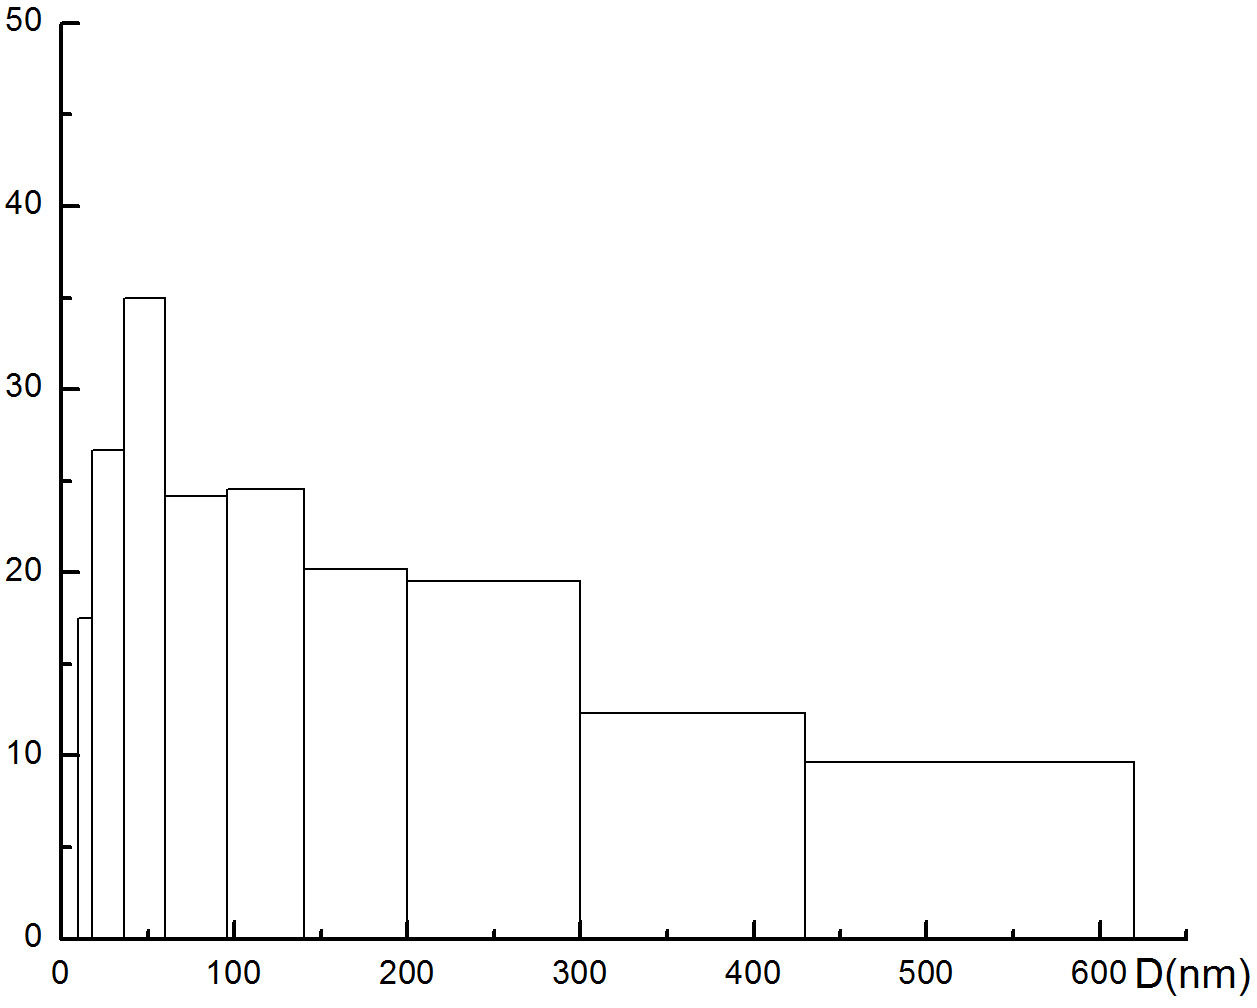
Fig.1 and Fig.2 had compared the process results of electrolytic by SEM. Meanwhile, data of Tab. 1 were the calculation of γ´ size from Fig. 1 by different area. The results of them are totally different for the same status of SCSA after age treatment. Tab.2, the size distribution, changing during the heat treatment, of γ´ is the details from Fig. 3. The quantity of nano powder smaller than 96 nm were lighten to show as size evidence of nano information in SCSA for discussion.
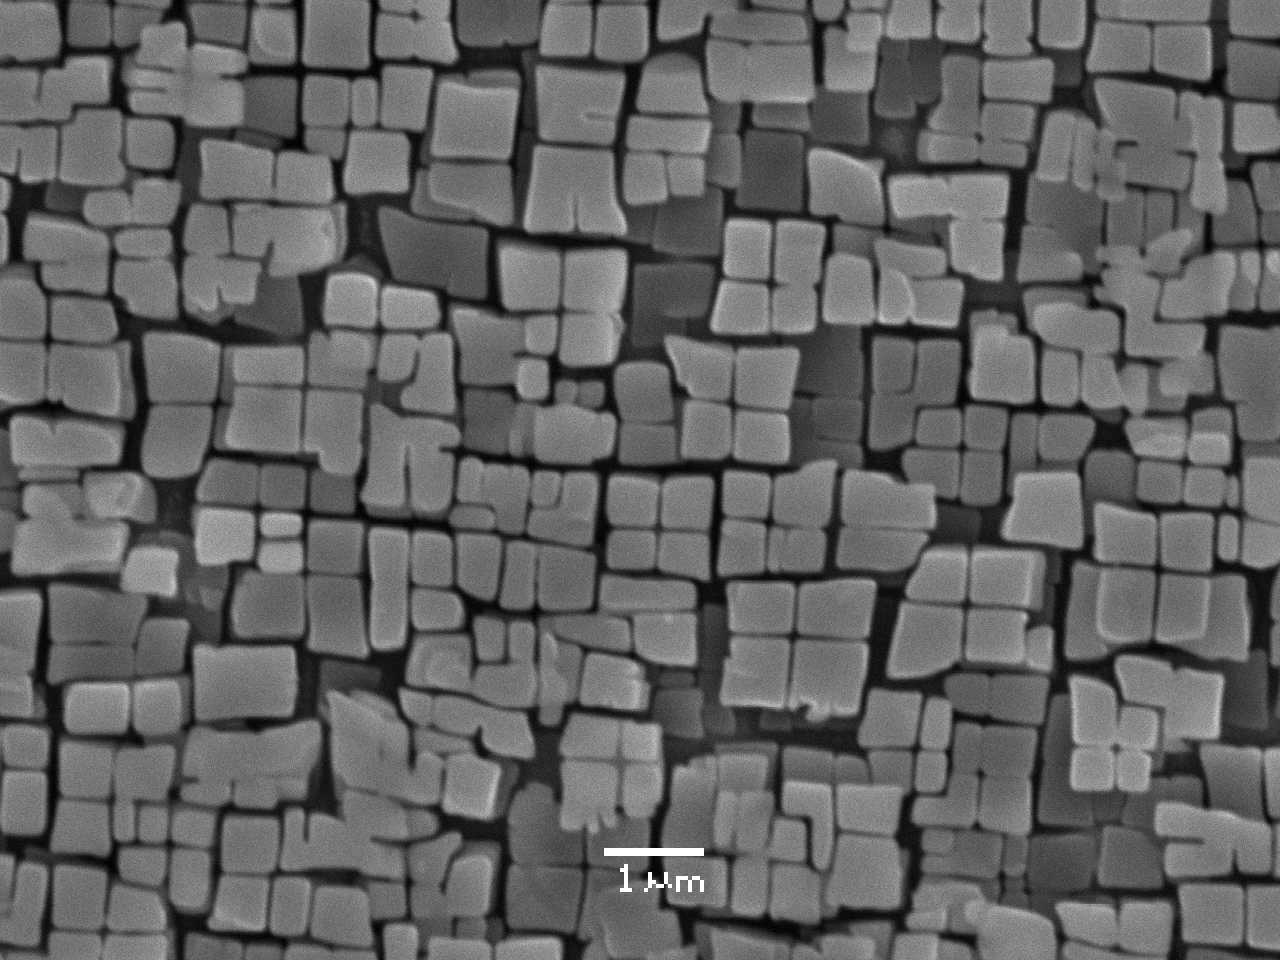 a) After casting.
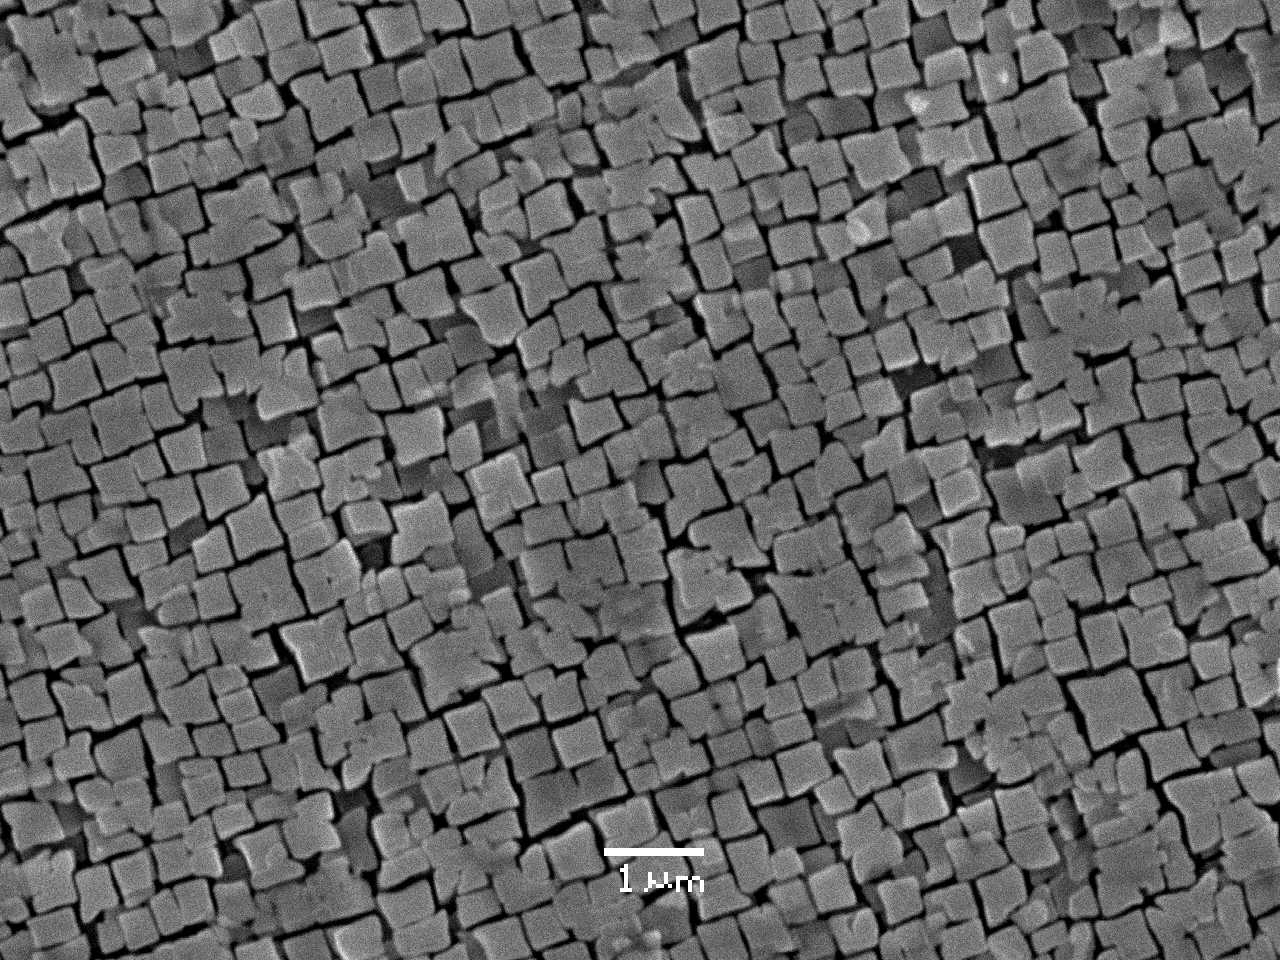 b) After quenching treatment.
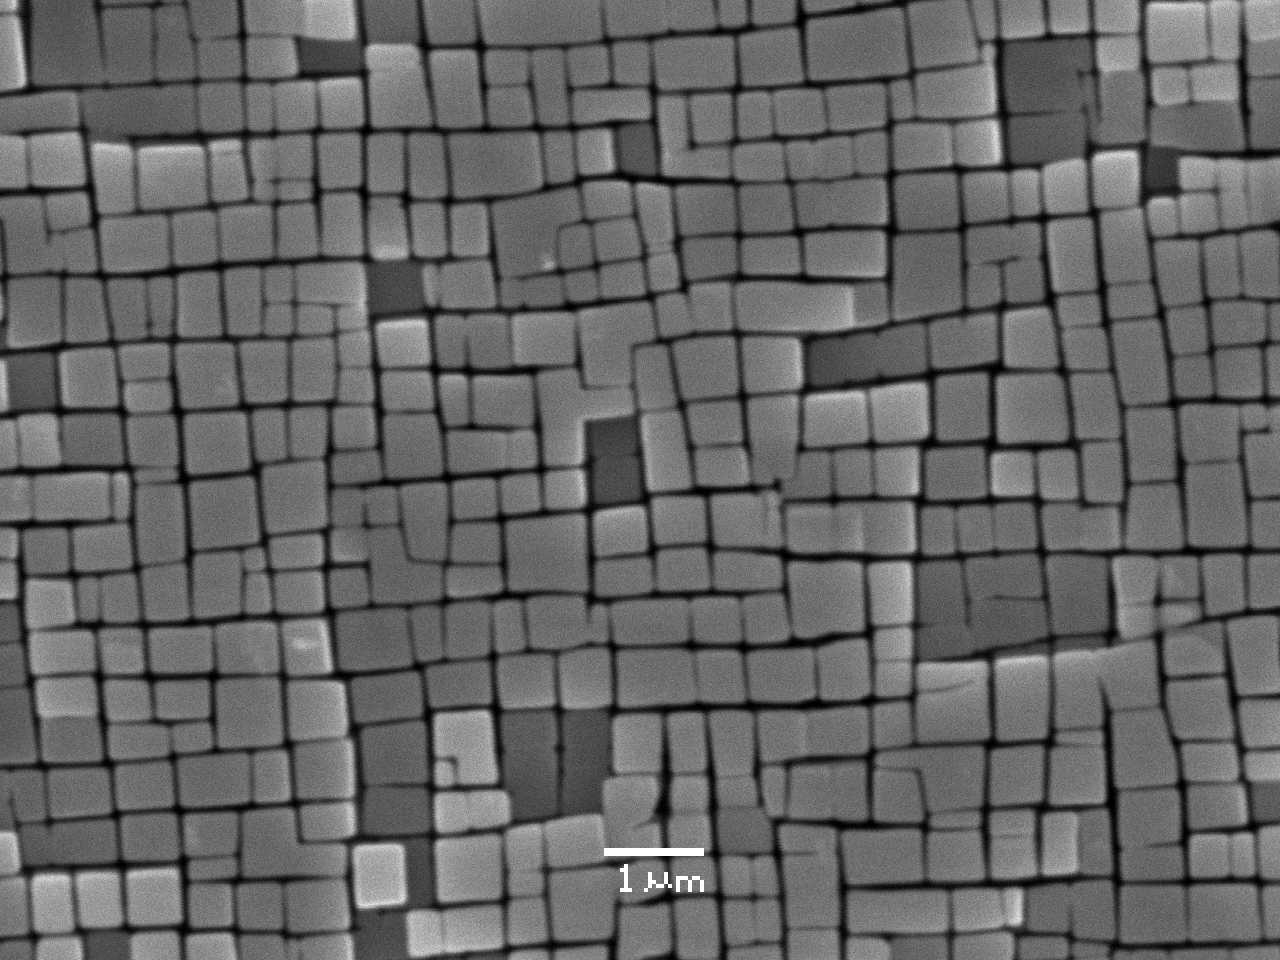 c) After age treatment.
 d) The new γ´ precipitates in the γ channels after the aged treatment.
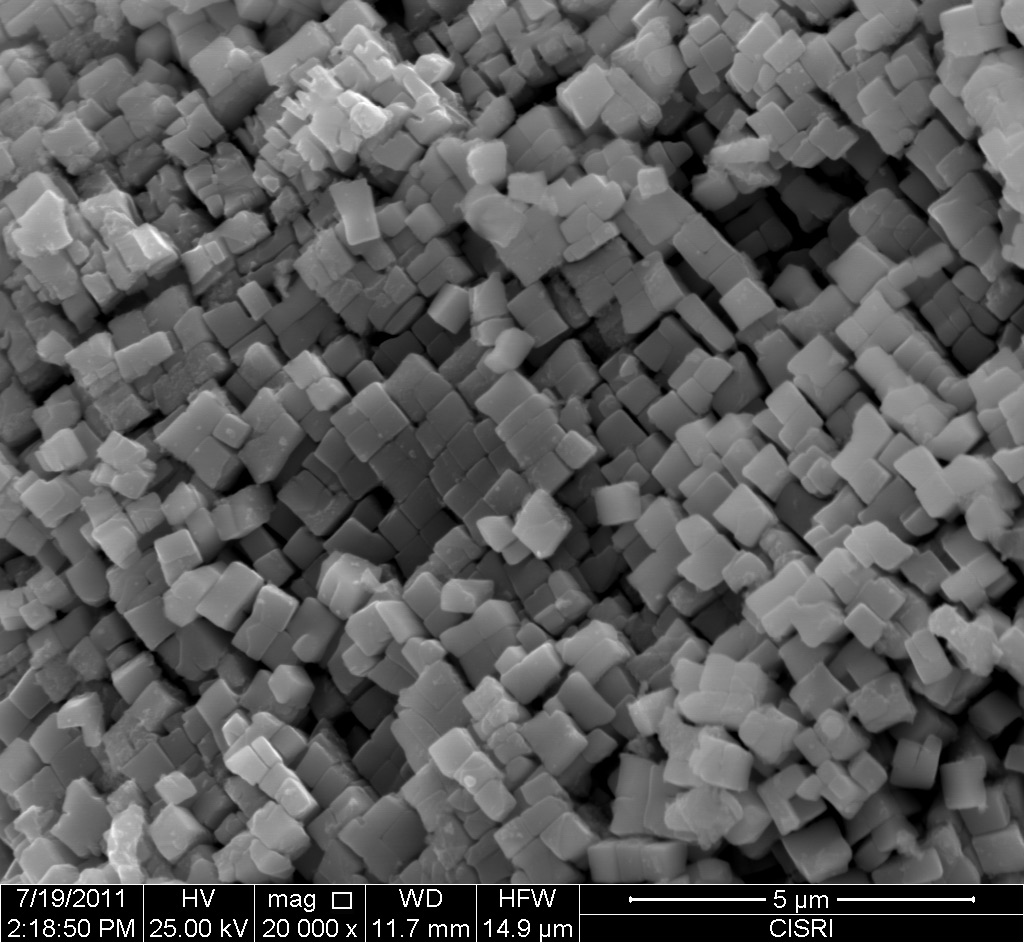
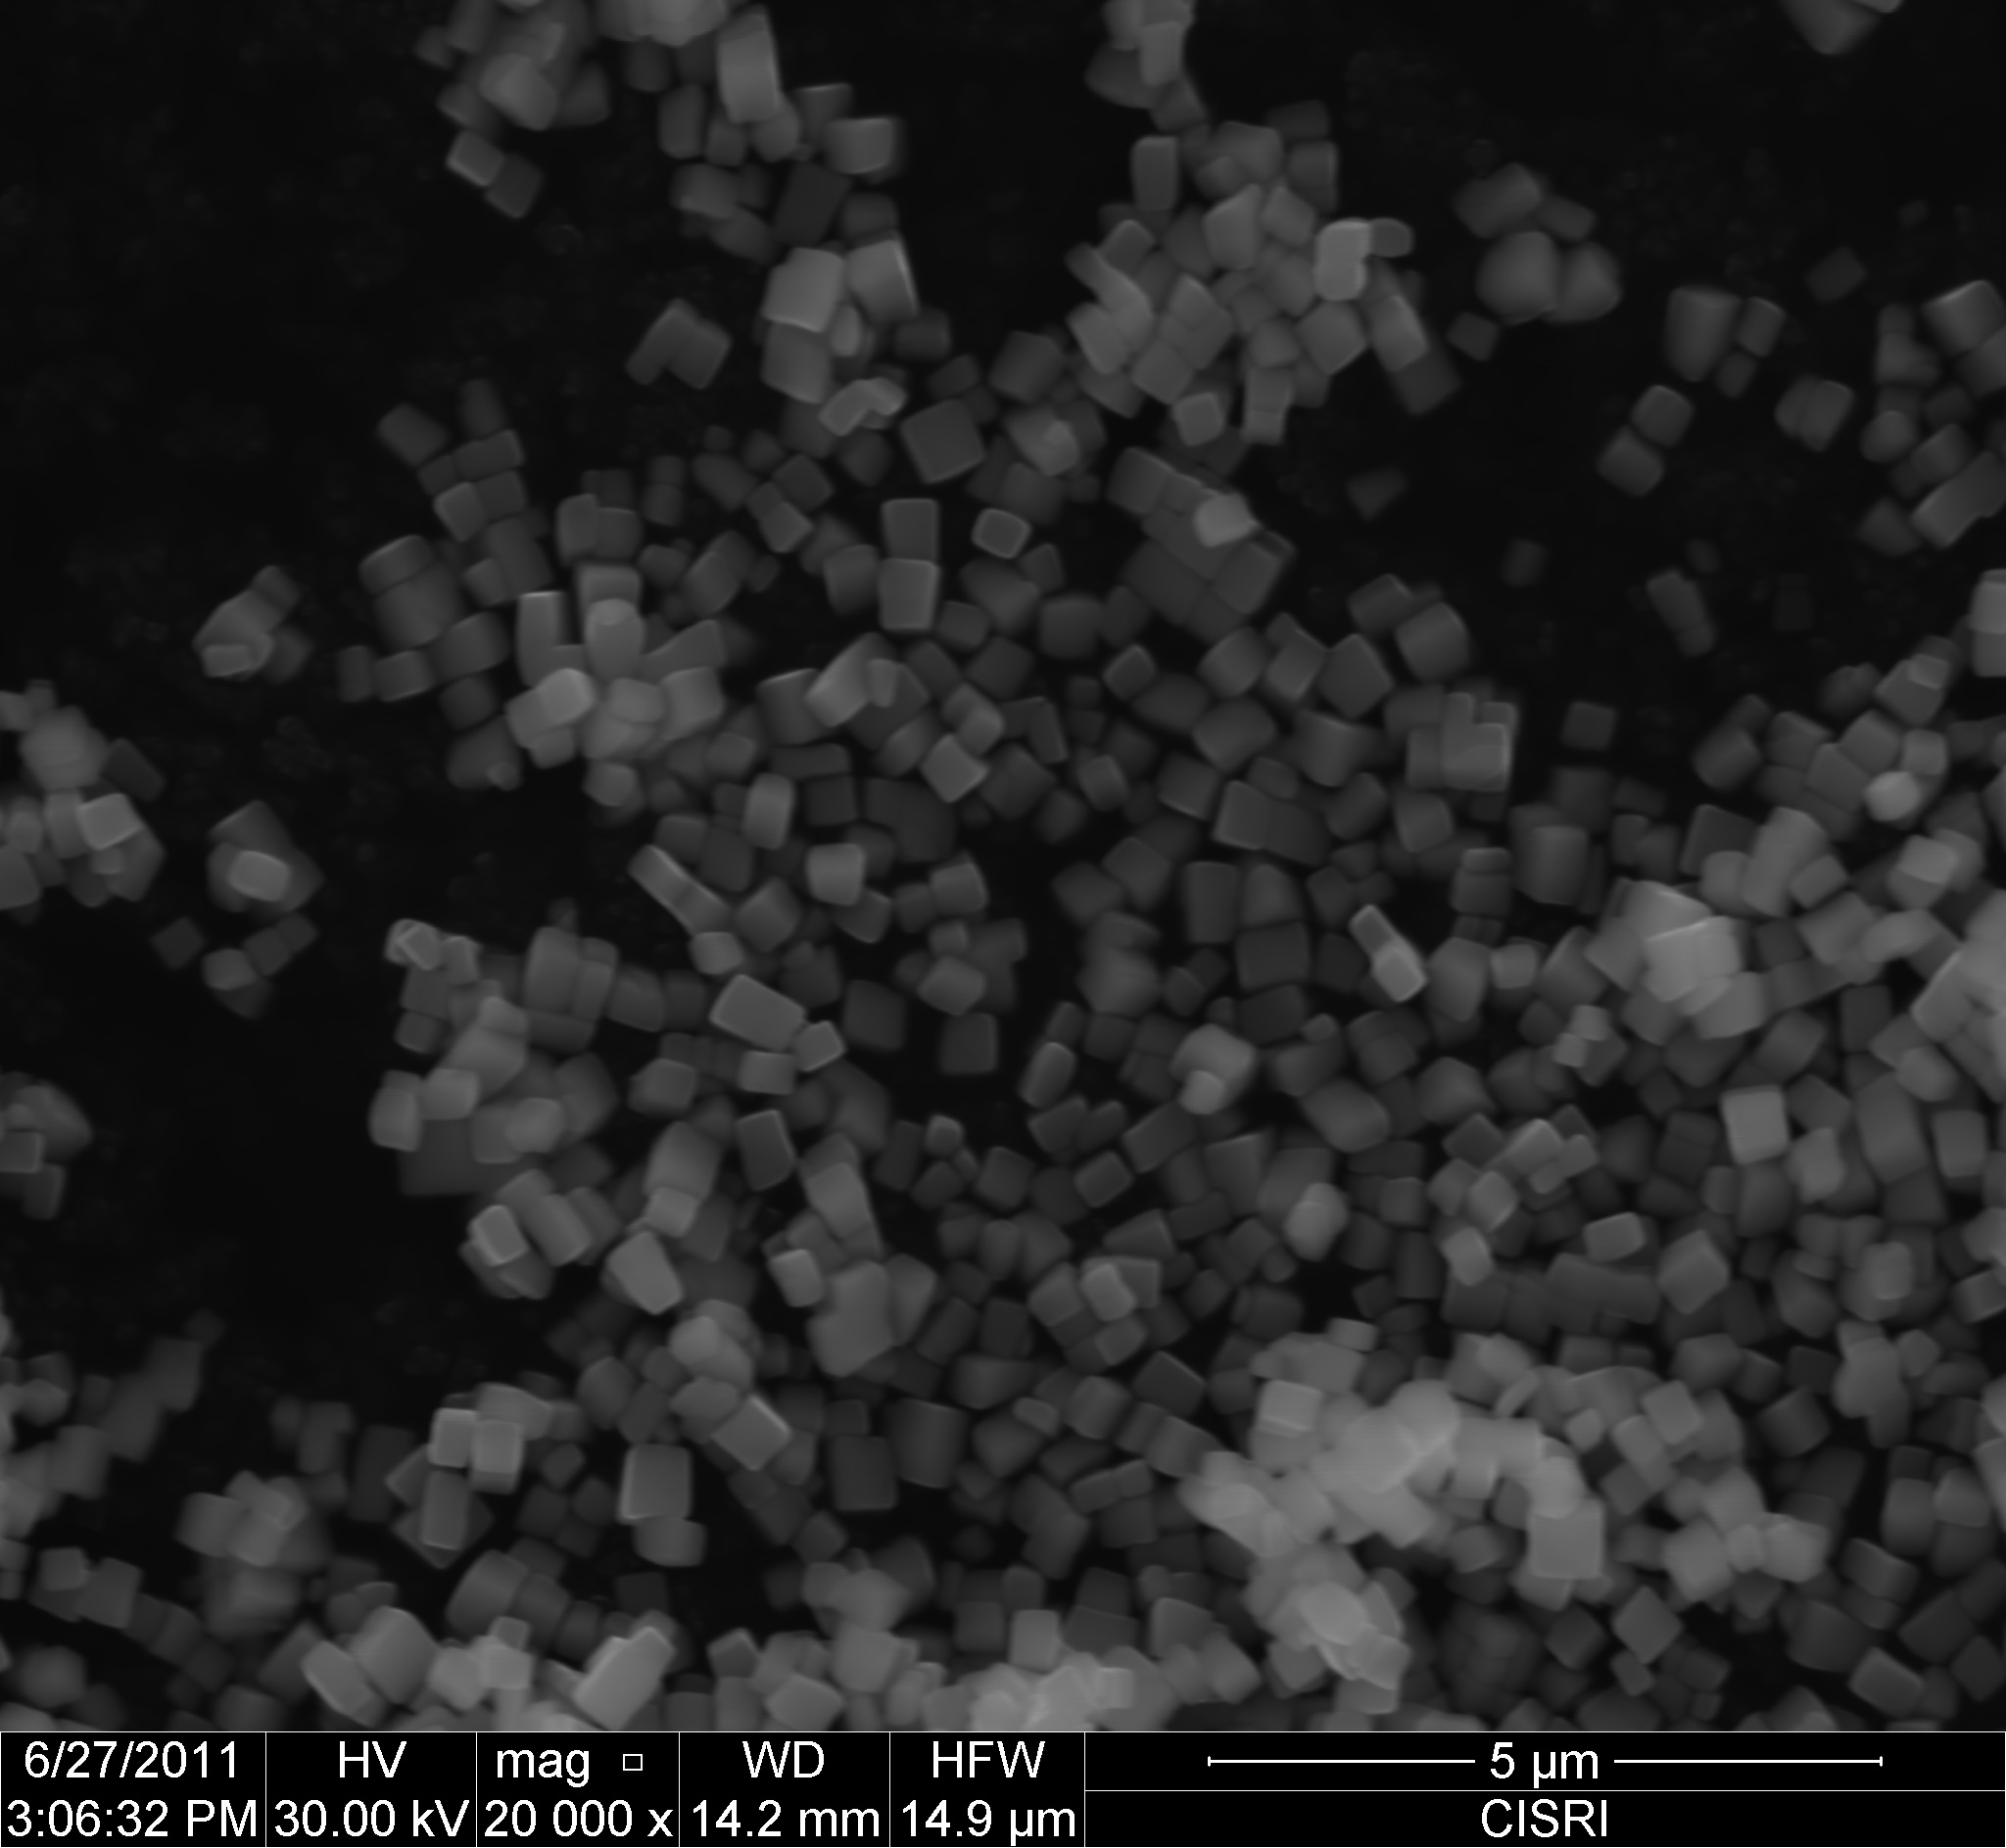
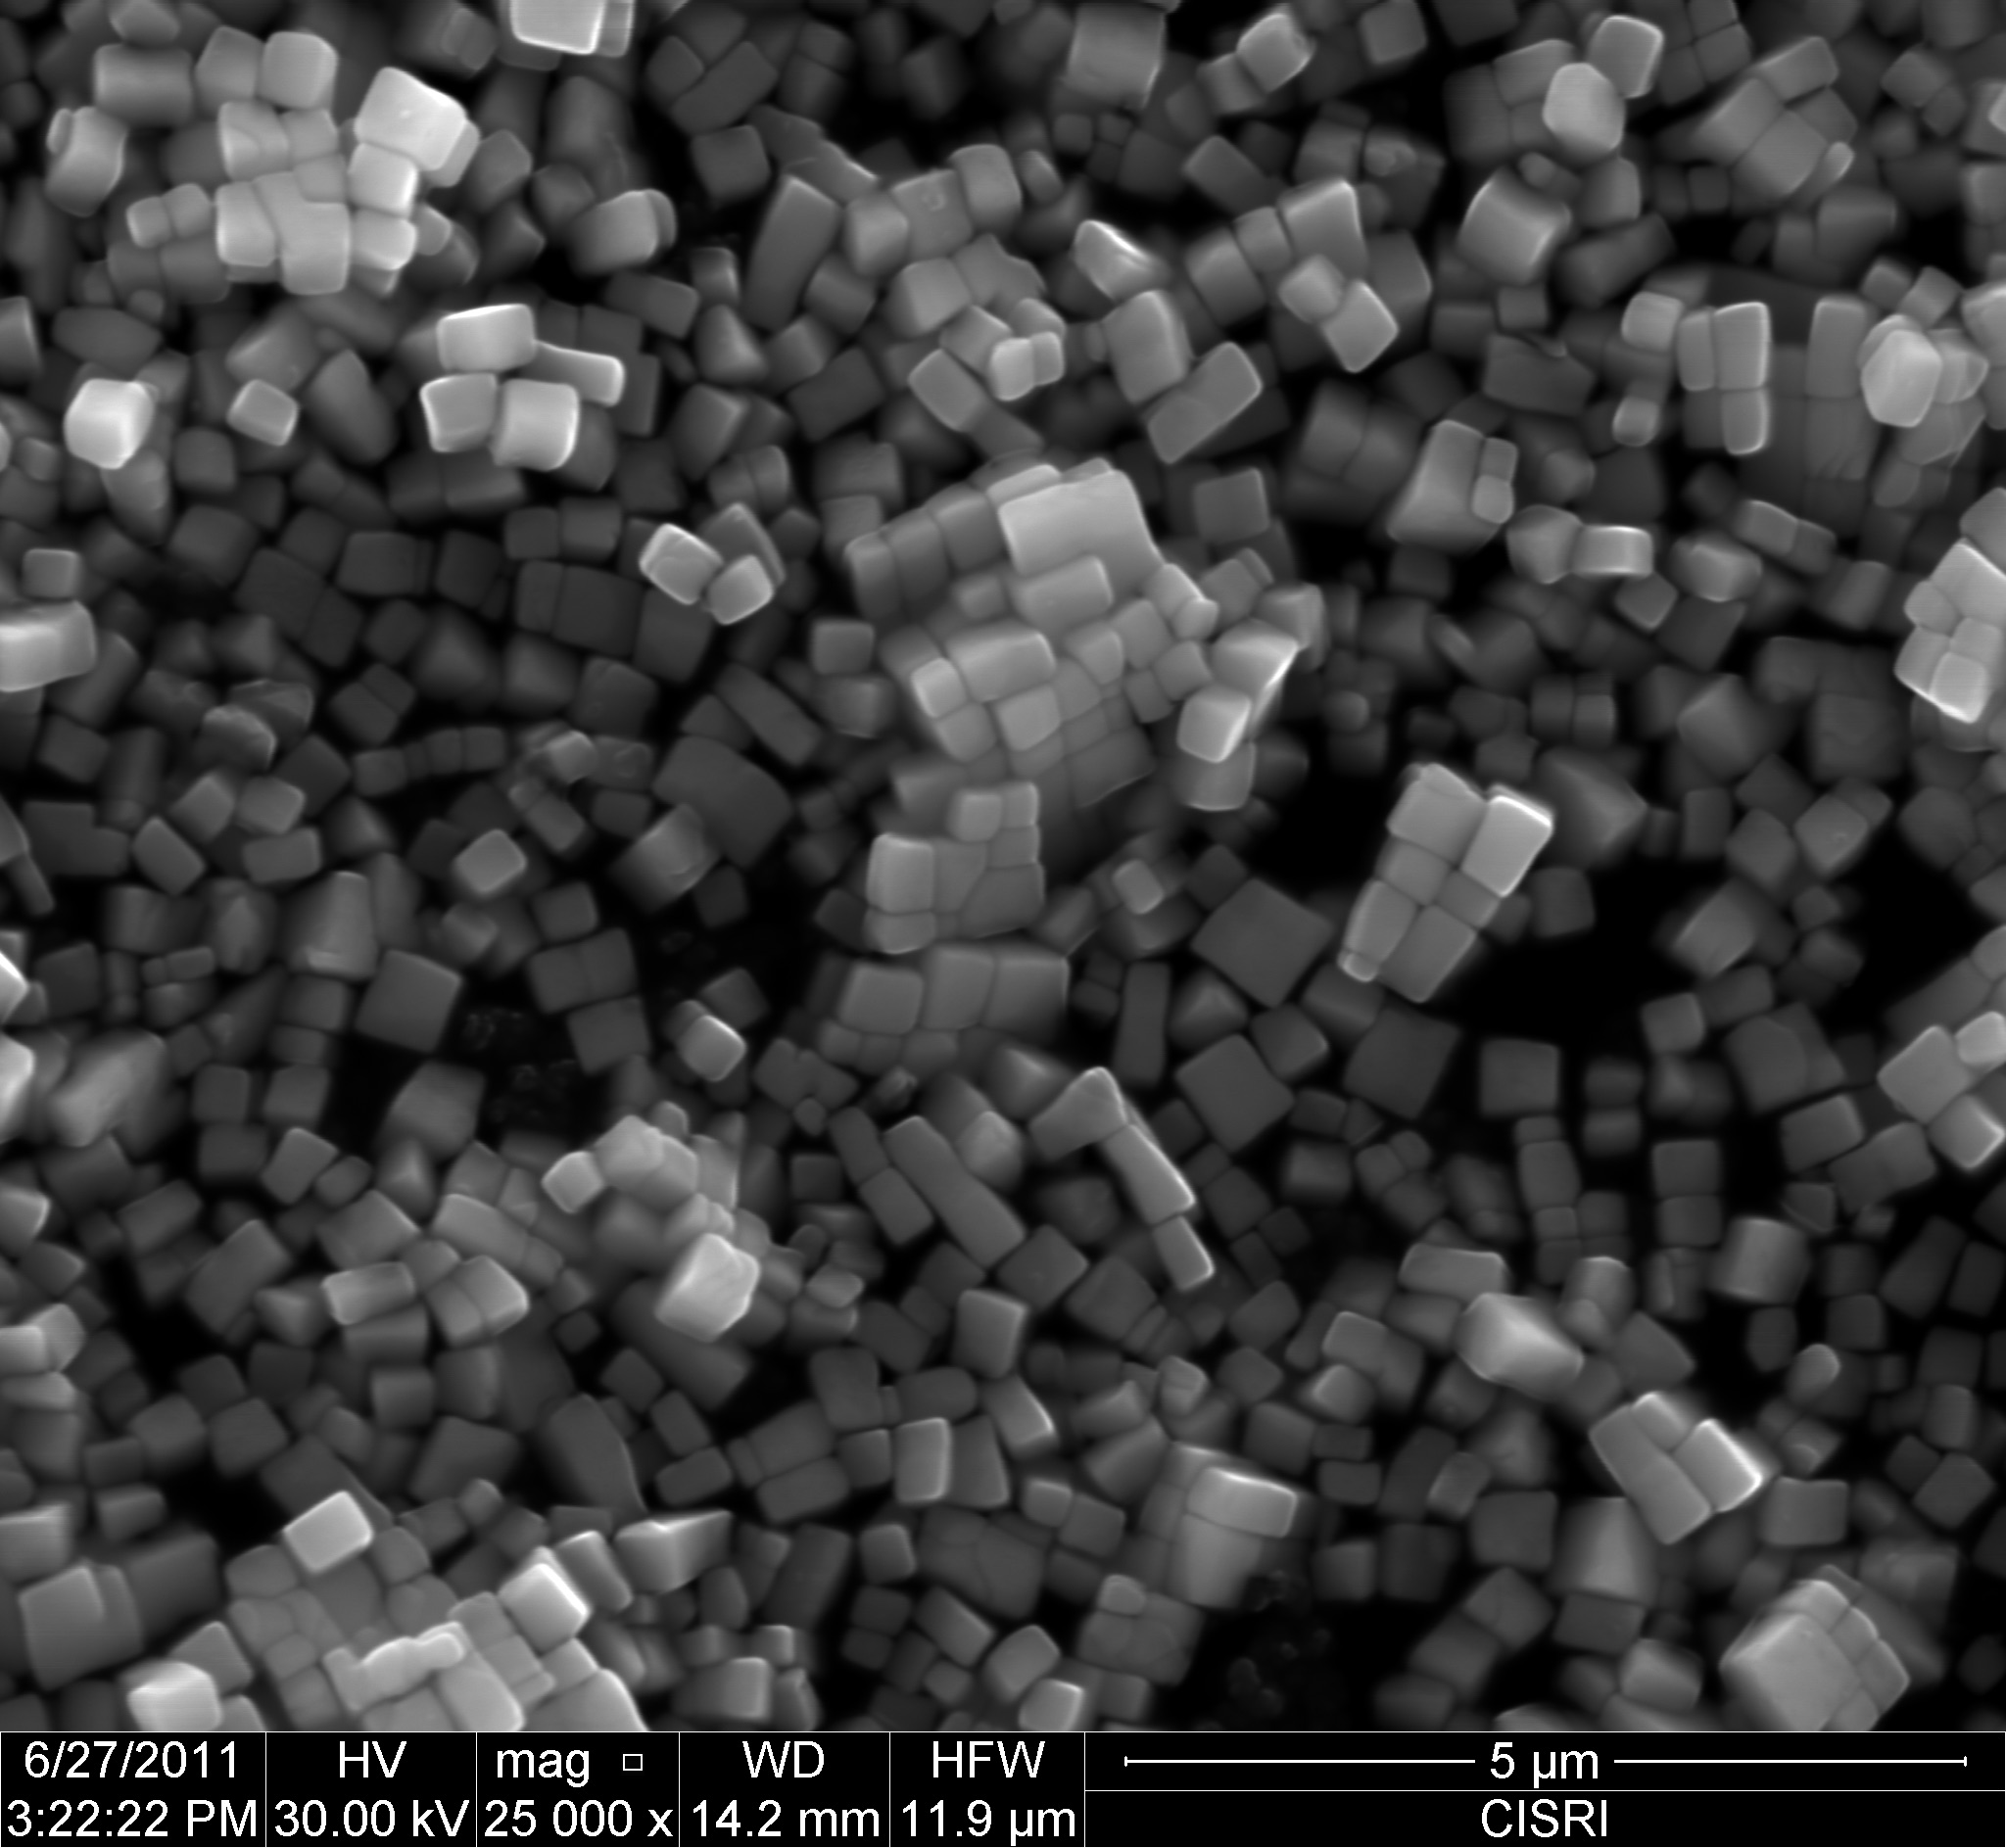
Table 1. The average size of precipitates after the aged treatment using c) and d) inFig.1 by SEM observation.
| Average size from Fig. 1 c), nm | Average size from Fig. 1 d), nm | |
| After age treatment | 491.2 | 97.7 |
Table 2. Quantity changing during the different heat treatments via SCSA measured by balance.
| Size Interval, nm | After casting | After quenching treatment | After age treatment |
| 10~96nm, wt. % | 12.6 | 29.4 | 23.3 |
| Mean Size, D, nm | 281.3 | 211.6 | 248.9 |
| Median Size, d50, nm | 257.9 | 173.2 | 219.8 |
| Distribution Spread, B, nm | 157.4 | 153.7 | 166.7 |
Table 3. The detail data of the γ´ distribution in Fig.3 during the heat treatment.
| Quantity of electrolysis, g | Quantity of γ´ phase powder, g | Weight proportion, % | |
| After casting | 4.0965 | 2.5654 | 62.62 |
| After quenching treatment | 2.0526 | 0.6437 | 31.36 |
| After age treatment | 2.6771 | 1.8417 | 68.79 |
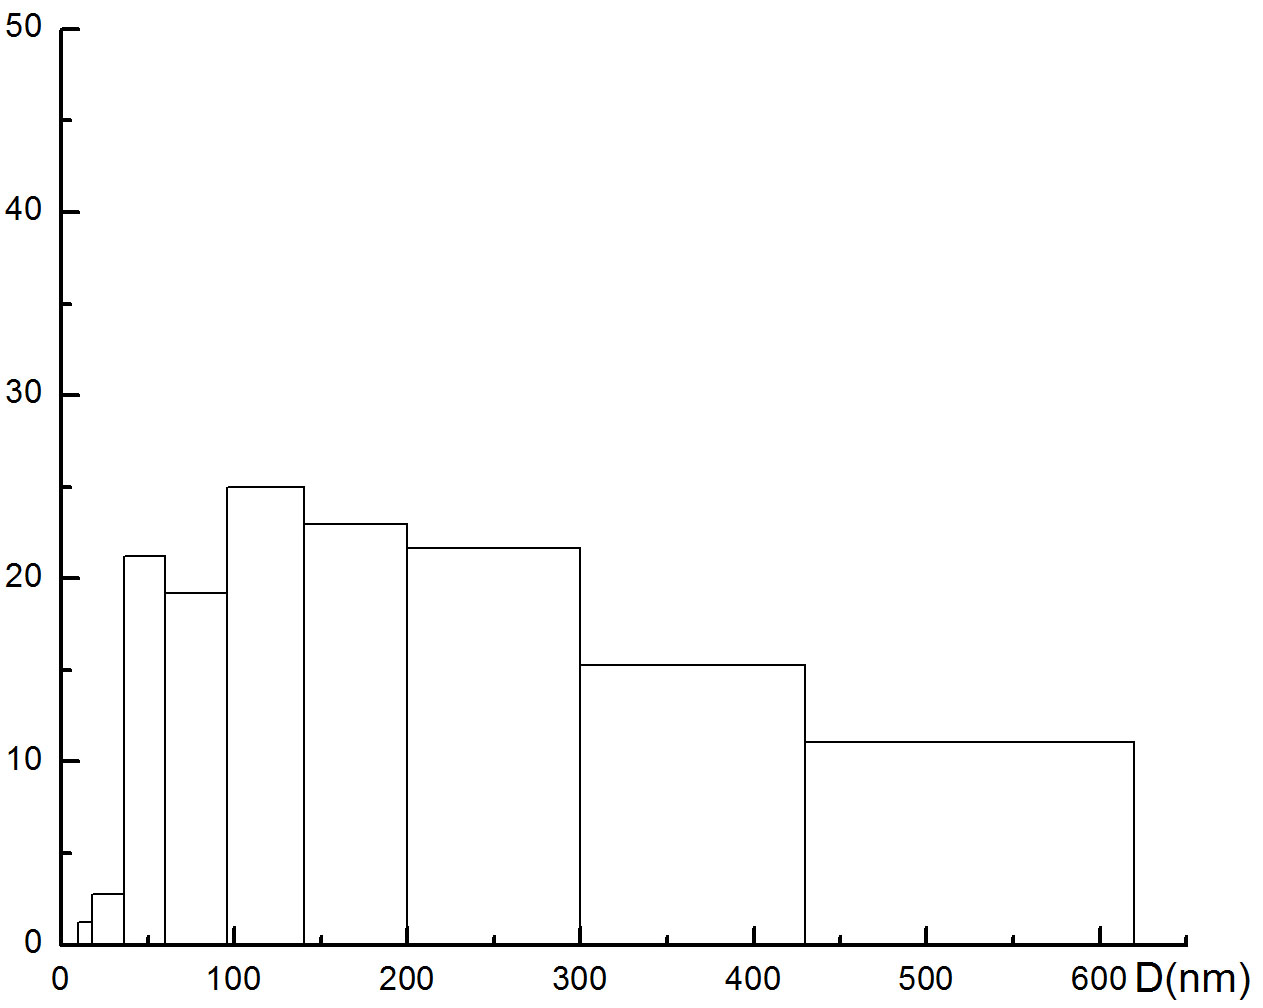
Since γ´ takes part in a very important role for precipitation strengthening of SCSA AM3, the more fine of γ´ in AM3, the more high strength of SCSA AM3 will be. For this reason, the quantity of weight and size distribution, mean size and median size and distribution spread, of γ´ were shown in Tab. 2. Mean size is the average size of all particles, median size, d50, is average of all particles with influence of distribution curve or the half size on the distribution curve, and distribution spread will be discussed in the next chapter. By Tab. 3, the quantity of electrolytic process of γ´, and Fig. 3, the distribution of γ´, funny discussion will be processed.
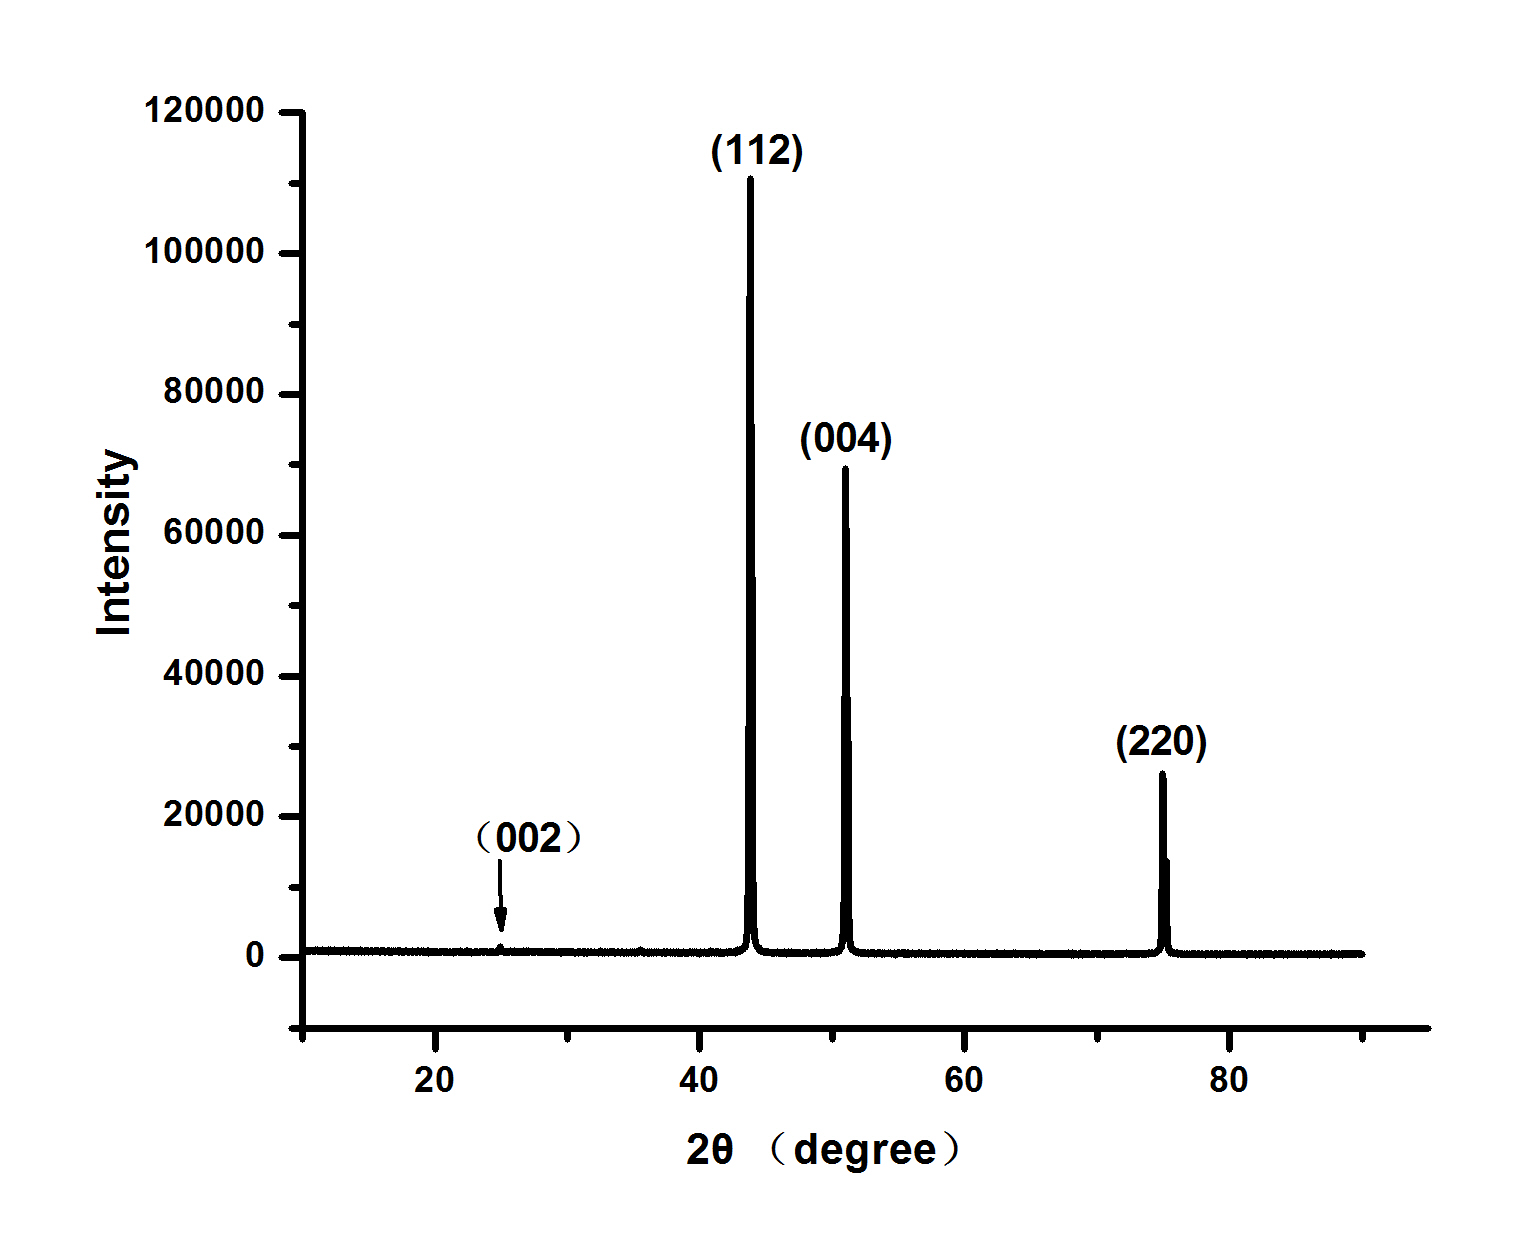
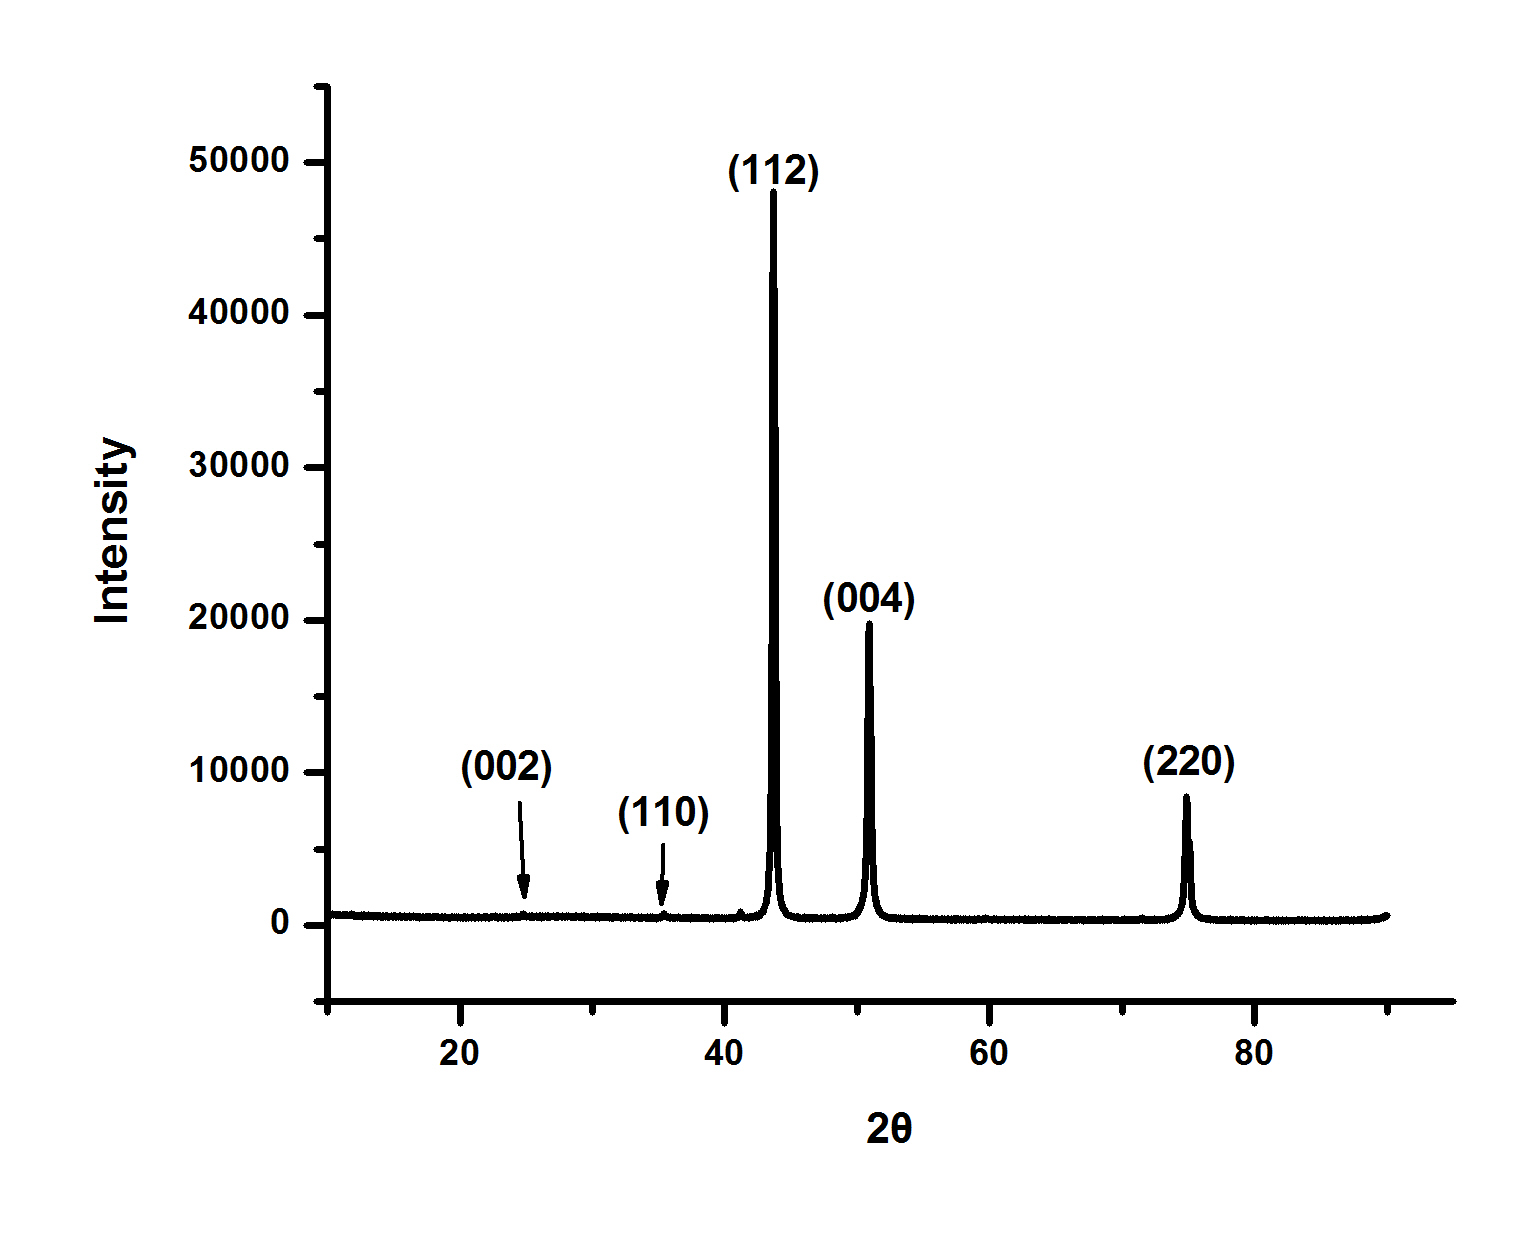
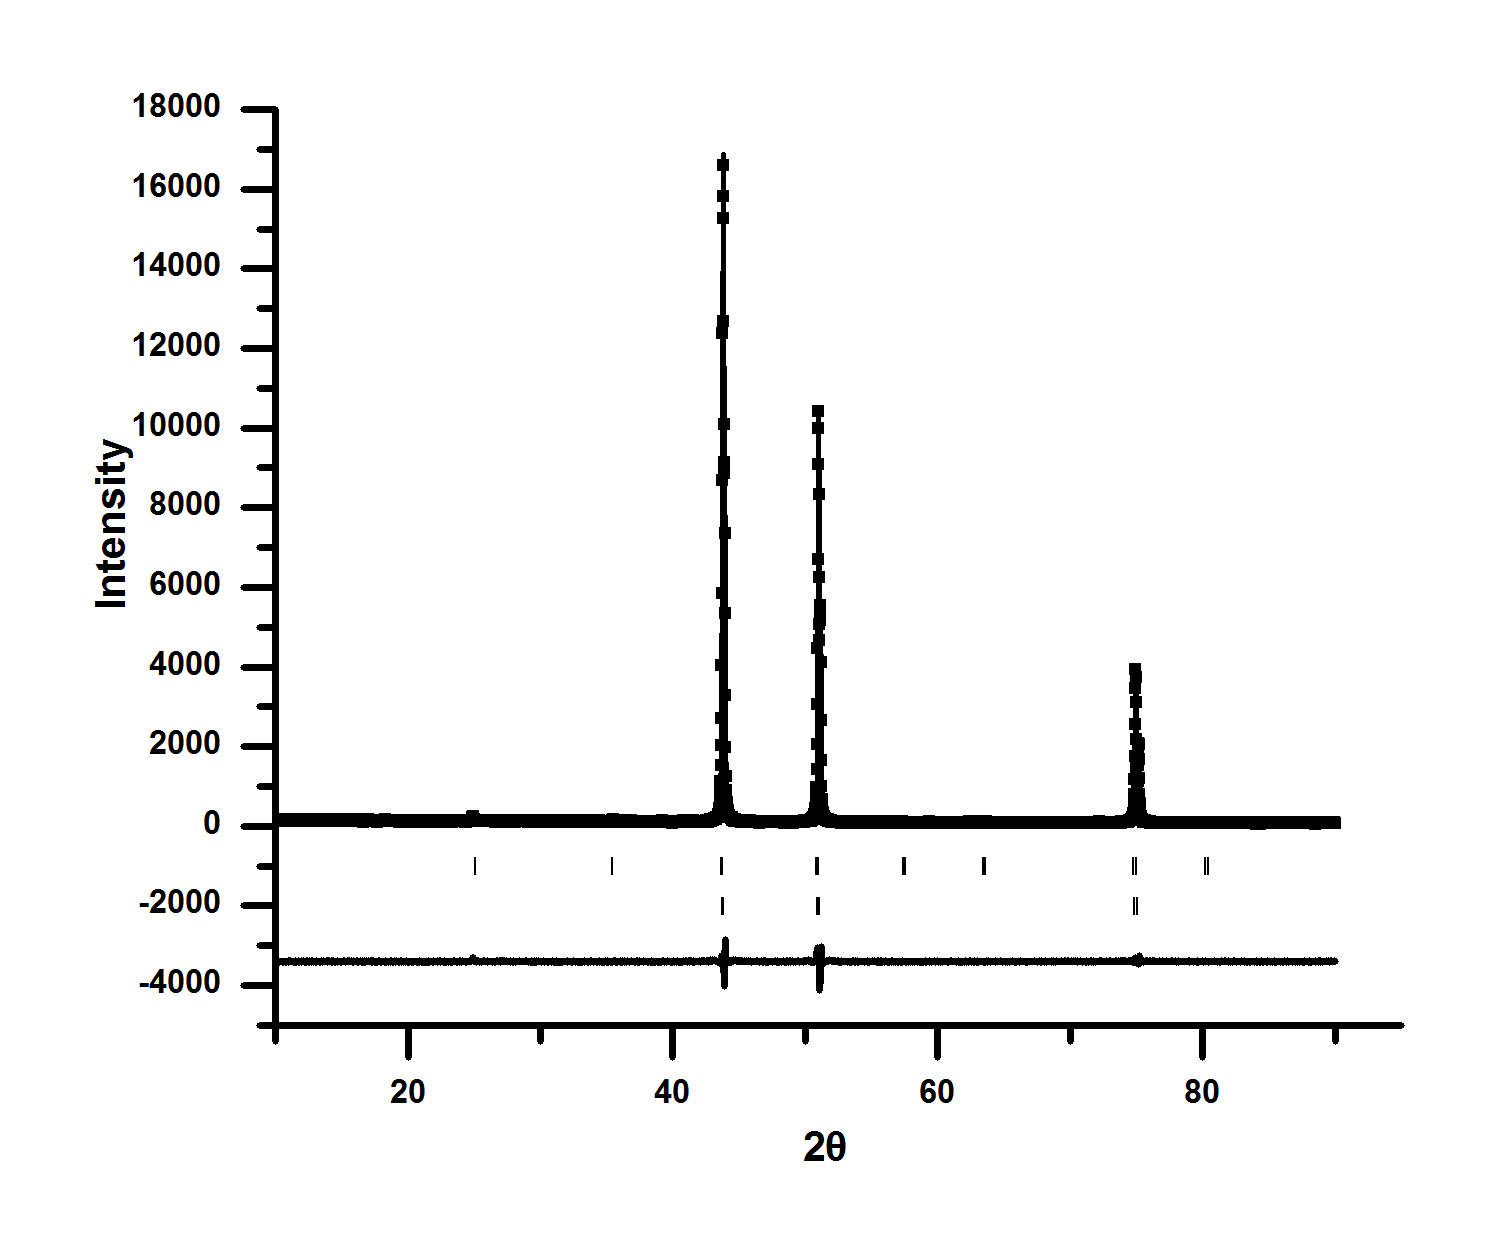
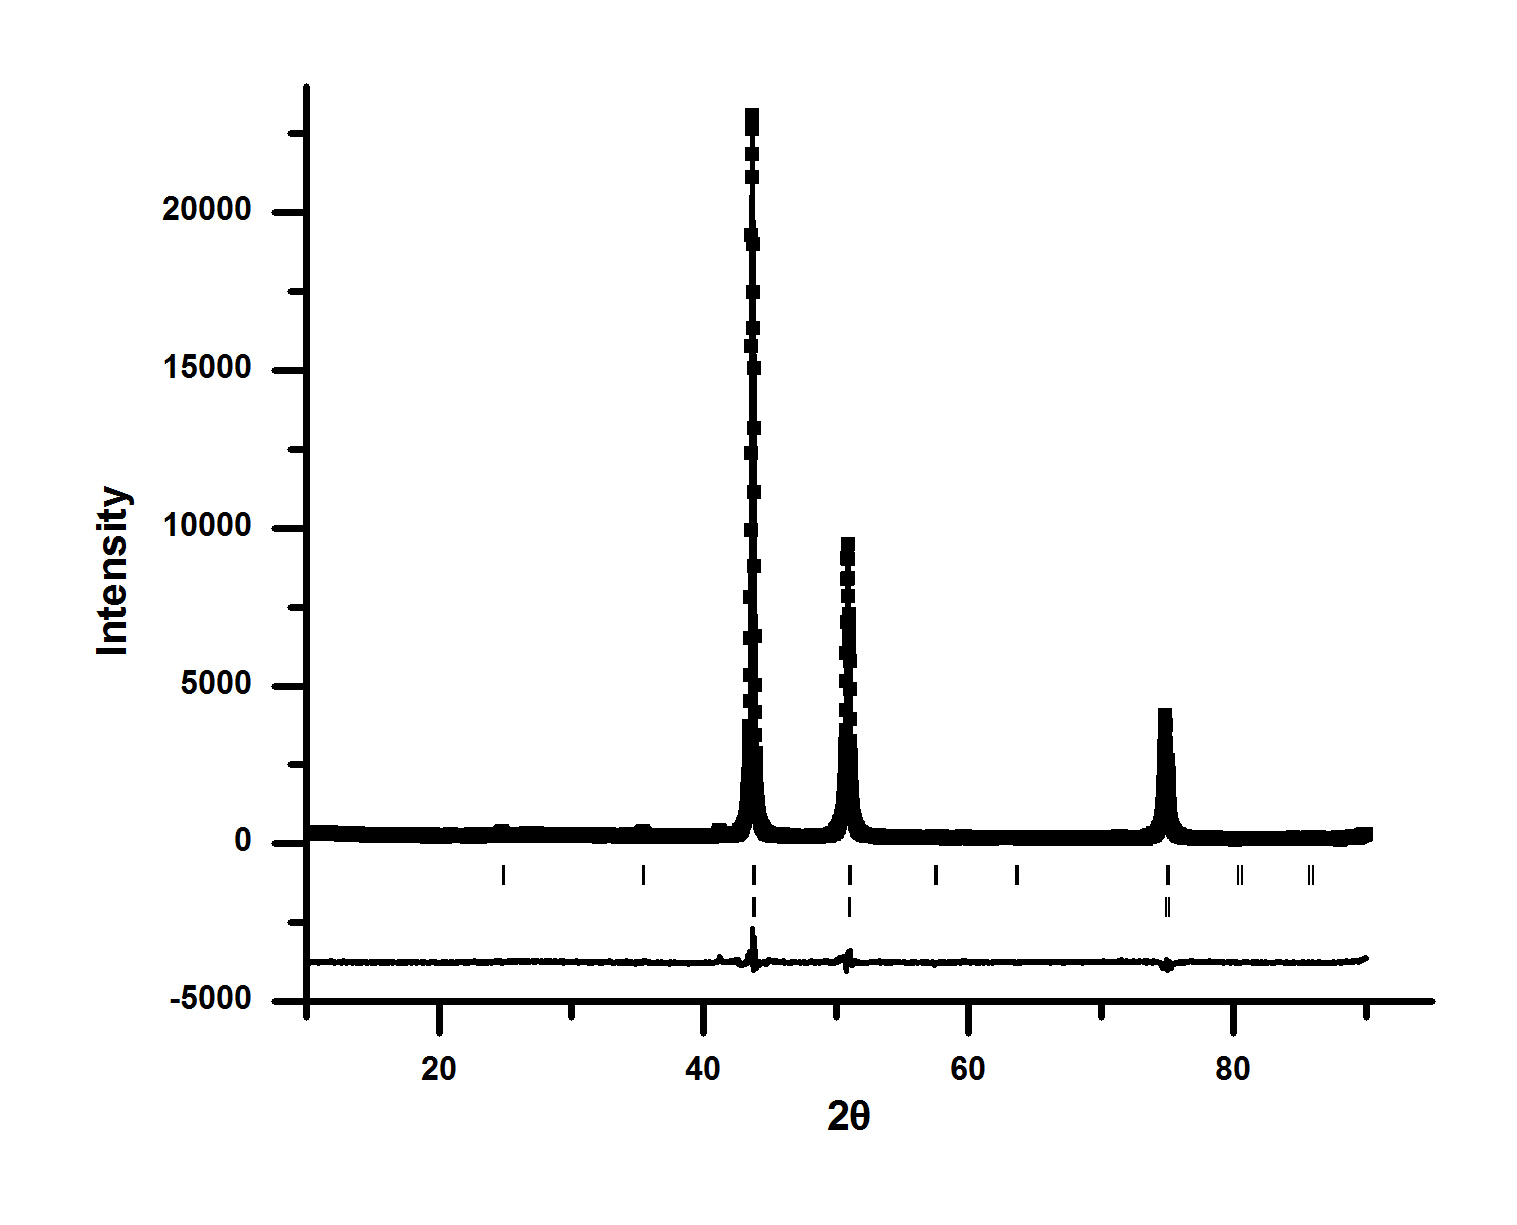
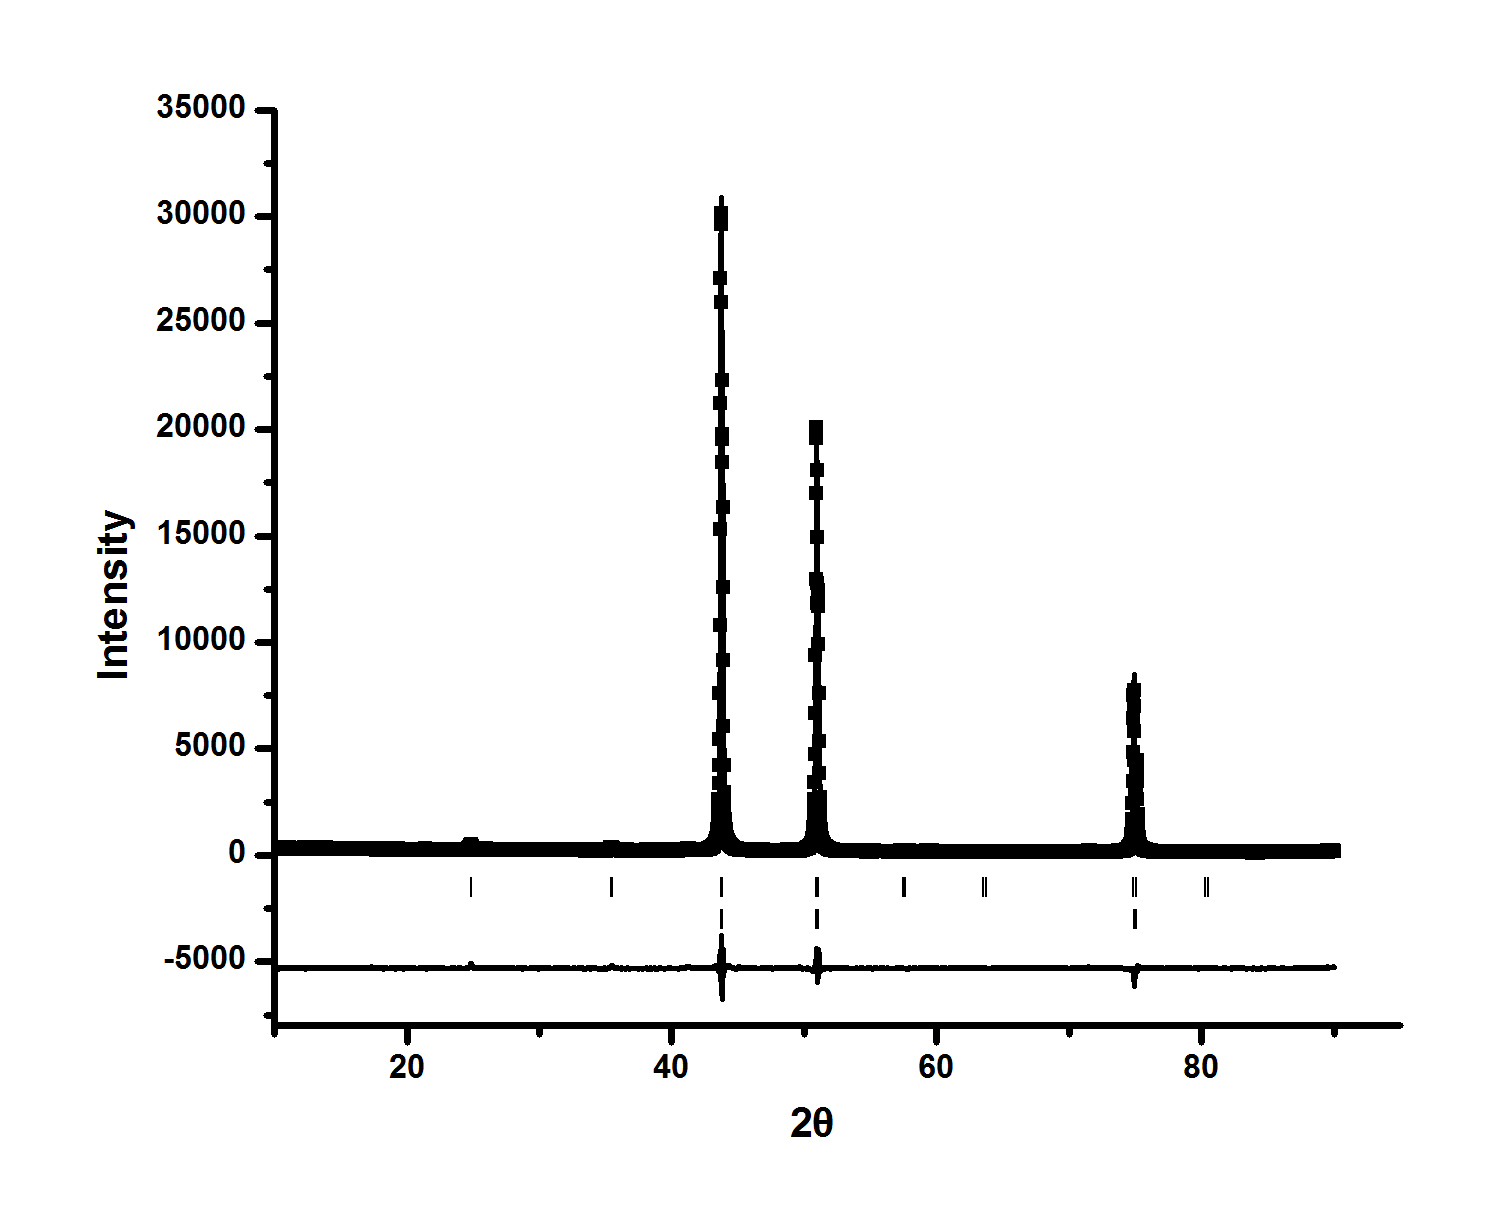
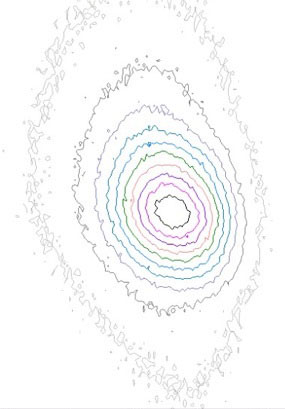
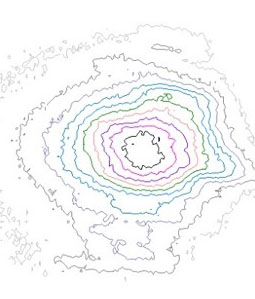
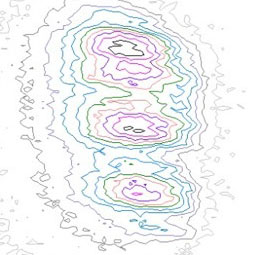
Fig. 4, the data from XRD measurement, Fig. 5, the indexing result of powder samples by TREOR and the calculation result of Rietveld, were the changing quantity of crystal structure of γ´. Results of {331} Pole Figure by Reciprocal Space Mapping, a sensitive method for crystal structure, not good at quantitate, were shown in Fig. 6 to check if there is some changing of crystal structure happened. More results of calculation, Fig.8 and Tab. 7, is in chapter 4.3 with in situ measurement discussion of arrangement or location of atoms.
4. Discussion
4.1. The distribution measurement of size on sub-micro-sized and nano-sized by SAXS
Although Fig.1, matched with Fig. 2 very well. For the reason of lack of particles, the different results from Tab.1 on particle size of the same one sample is so wrong on the statistics. Furthermore, the tiny particles fell among the bigger in Fig.2, the result of SEM is only a wrong reference in this paper.
Soberly, all SCSA are one kind of quasi-single crystal material, with every γ´ particle inside as a nano and sub-micro meter scale single crystal and the whole body of SCSA been considered as a material of composites single crystal. Obviously, the distribution of γ´ on nano and sub-micro meter scale in the AM3 SCSA, as a structure material, is very important. So, XRD and Neutron ray diffraction (NRD) were used by Gilles [7], considering the grain size as the particle size of γ´, to measure the grain size of γ´ after the electrochemistry process. Unfortunately, the broadening of peak in XRD pattern which Gilles used has different origin, the peak broadening in small angle on pattern coming from the size of fine grain, and the broadening of big angle coming from the dislocation and other reason of the material. Usually, to avoid the effect of fine grain, the Rietveld calculation was started from lesser angle, such as 15-20°, and was thought that the biggest grain size been calculated using peak broadening is around 80nm. So, the measurement of particle distribution in this paper is too difficult to complete from sub-micro-meter to nano-meter based on peak broadening of γ´. Meanwhile, there would been a lot of discussion on whether dislocation test or not about the results of Gilles paper, which was around 80 nm in the Fig. 9 and Fig. 10 among his paper using peak broadening, both of pictures starting the calculation bigger than 20° [7].
During the measurement of SAXS, including small angle Neutron scattering (SANS) for the reason of similarity calculation process, tens of billions of γ´ particles were measured, which was been thought as the method with statistics result [8, 9]. More discussion about the theory and the statistics of SAXS will be completed in the next part of this chapter, and here is only the effect between SAXS and SANS on the AM3 SCSA. As many literatures mentioned, the penetration of Neutron ray being better than that of X ray, the characterization of synchrotron and SANS on γ´ of Ni based SCSA is very good to use. However, lack of the using of SANS and synchrotron in China, there were only SAXS can be easily used in lab. Based on Guinier plot method [10], many papers were published on the average size of precipitates [11]. It is believed that the mean size, calculated from the all the distribution may be equal in two total different distributions, is a good result, but not being as good result enough. So, the results from such papers, which were got in the past, maybe wrong at all.
The most difficult discussion is the theory of SAXS itself. Why so many papers published with only result from 1nm to 100nm, and so many calculation results from the same SAXS curve? Is there real lack of evidence from 100nm to 1 µm as authors imaging or they were omitted in SAXS data? Many calculation theories, which focusing on the particles distribution calculation of SAXS, were discussed in the conference and paper [8, 9]. The calculation model being called bloody theory, Dividing Distribution Function (DDF) in this paper better than Rigaku model [12], which author of this paper don’t like very much but the choosing of better calculation model which is good for size distribution from 1nm to 1µm or 999nm than DDF, will not be discussed here. One of the most important errors during the SAXS is the density difference between the sample and surrounding. Five times of the sample and surrounding of the powder, density of γ´ is 8.2g/cm3, and density of nitrocellulose is 1.66 g/cm3, the measurement process was calculated without negative, and was thought as very credible. Details of the matrix calculation theory will not be discussed here. However, the distribution of γ´ from nano-meter to sub-micro-meter, according the annex of test accuracy and examples of ISO/TS13762:2001[5] and papers [8, 9], which had been measured and published, was usually regarded less than 5 nm for metal.
As the Fig.1, Fig.2 and Tab.2 matching the trend of heat treatment, the further discussion of SAXS result, Fig.3, in this paper is very funny.
Since the model of particle was assumed as spherical, the part of test signal, the less 96nm in SAXS results, was considered with the second new γ´ and the irregular tiny edge of big γ´ particle. Mean size and middle size had proved that γ´ became smaller and fusion in γ during the quench treatment, and became bigger after aged treatment. However, based on 23.3% less 29.4%, why was the weight ratio of γ´ reduced after age treatment? Few of trustful proof, that indicated the statistics precipitation of second new γ´ in the SAXS test, was found in the measurement data. All these produced the discussion about the value of B, broadening or distribution spread of particle size. The calculation of B was shown in the follow formula.
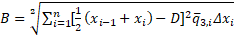
Where, x, particle size, diameter of a sphere,  , length of particle size interval,
  , q3,i, average density distribution of the class
  by volume or mass D, mean size,
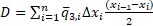
Obviously, the value of B should be zero on the condition that all particles are in the same size such as pollen of nature. No doubt this value should be becoming bigger because of the broadening of the distribution of the particle size, and was connected with the precipitation of new second γ´ during the age treatment. The fancy caught the direct proof in Tab. 3 on the bigger of 166.7nm value with 157.4nm and 153.7nm. Whatever, new γ´ or the distribution of particle size was not changed during the quenching treatment on the value 157.4nm and 153.7nm. However, 166.7nm was the proof that there are really do new γ´ deposited, which was the origin of the broadening of the distribution. This conclusion matches the changing of SEM, and is better than the mean size result in many previous papers.
However, there is another fatal question on the SAXS result of SCSA in this paper. Why is there not so much similarity between a) and b) of Fig. 3, they should have more similar. The reason is that the histogram based on the area of the column. To avoid the negative in the calculation, each of the,  in the histogram is not equal, so
that the high of column means nothing. So, the similarity of a) and b) in Fig.3 is not very rich.
in the histogram is not equal, so
that the high of column means nothing. So, the similarity of a) and b) in Fig.3 is not very rich.
4.2. Comparing of SAXS measurement with other measurement
It looks like there were enough evidences of SAXS on measuring of SCSA, and no more talking should be done about size measurement of nano-particles. However, how about other measurement methods about nano powder including SCSA material? Many papers and researches, no evidence shown all of them are good enough with evidence of repetitious, published in public were based on the picture of TEM and Laser, which had also been used to judge the size of nanoparticles. Some papers even announced that result from SAXS was not good, and some papers were even published based on the result from 70 nanoparticles by TEM. So, it is necessary to discuss something especially with TEM.
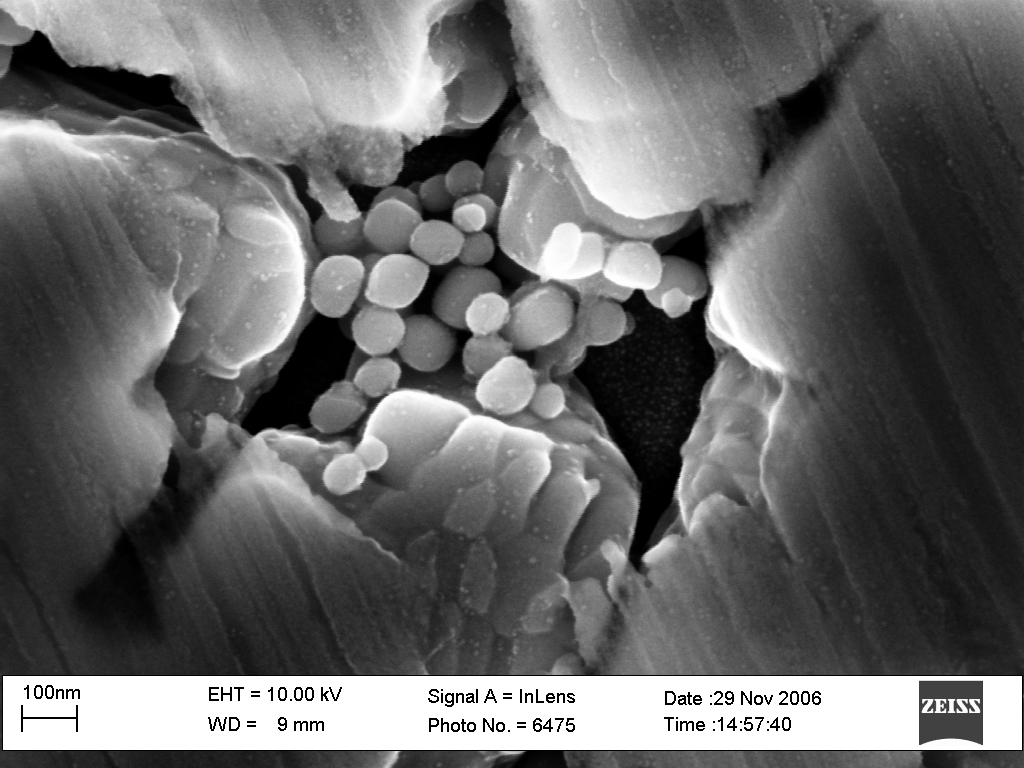
The first dialog is shortcoming of TEM, and here is a fetal evidence was selected, the lack of statistics information, and was highlighted in the Fig.7 which had shown two precipitated phases in the different steel. It looks like that there isn’t evidence of the difference about particle size between Fig. 7 being in fact as the different view from different samples. However, the measurement from SAXS which had shown a very huge different result and been related with several billion of nano particles in 15 mm ⨯10 μm test area and which is not been used as popular as TEM and SEM, is much better than TEM and SEM indeed. So, calculate the number of the particles in the SAXS process of SCSA measurement carefully 0.75 mg powder of γ´ particles were weighted during SAXS for Fig.3, and 15 mm ⨯10 μm area of the beaker with 35 mm diameter was lighted in SAXS test that mean 0.01169 mg γ´ particles had been tested. According the density of γ´, 8.2 g/cm3, and the SAXS test results of Fig. 3, the number of γ´ particles of each size can be calculated and list as a table in Tab. 4 and Tab. 5. Announcement, the results in Tab. 4, is not accurately for the reason being without the considering about the edge of lighting area being test and the shape γ´ nanoparticles which is rectangle indeed, so did Tab. 5, is here. However, it is already enough for the conclusion of SAXS better than TEM on this topic which is about the size of nanoparticles. It is wasting time to survey how many papers only with size data from TEM, or SAXS only from 1 nm to 100 nm. For drug, food, cosmetic, cleaning products, and so on, the papers only with particles size from TEM, without Laser, SSA, or other evidence that proved there is do not particles bigger than 100nm, can be regarded as lack of repetitive or statistic.
The second discussion is Laser method, a good method that are usually been used to judge the particle size from nano meter to micro meter and that depends on the decentralization process of aggregation that is a common kind of phenomena among the nano particles especially for the particles made from metal or ceramic, which is very useless and sick method for nano γ´ phase in SCSA. There are a huge lot of evidences about the useless of Laser method for the influence of aggregate phenomenon. X ray is electromagnetic wave penetrating material better than light of Laser, which is a kind of visible light.
The third, Specific Surface Area (SSA), also being called BET method, got the missing of the distribution of particle size and morphology of particle at the same time in ratio of weight and surface, can be compared with the ideal media size of γ´ phase in SCSA which calculated from SAXS result to authenticate the morphology of nanoparticles, rectangle or sphere. The comparing of the ratio of superficial area and weight, m2/g, which were calculated from the result of SAXS and were measured from SSA was not the same data for the same nano powder, was a very funny thing in one paper, which had been discovered and proved that morphology of nanoparticles are not sphere by TEM [13] had already been done. Full with the statistics from particle size and lack of the information of distribution size, SSA should be regarded as a good measurement of nano research.
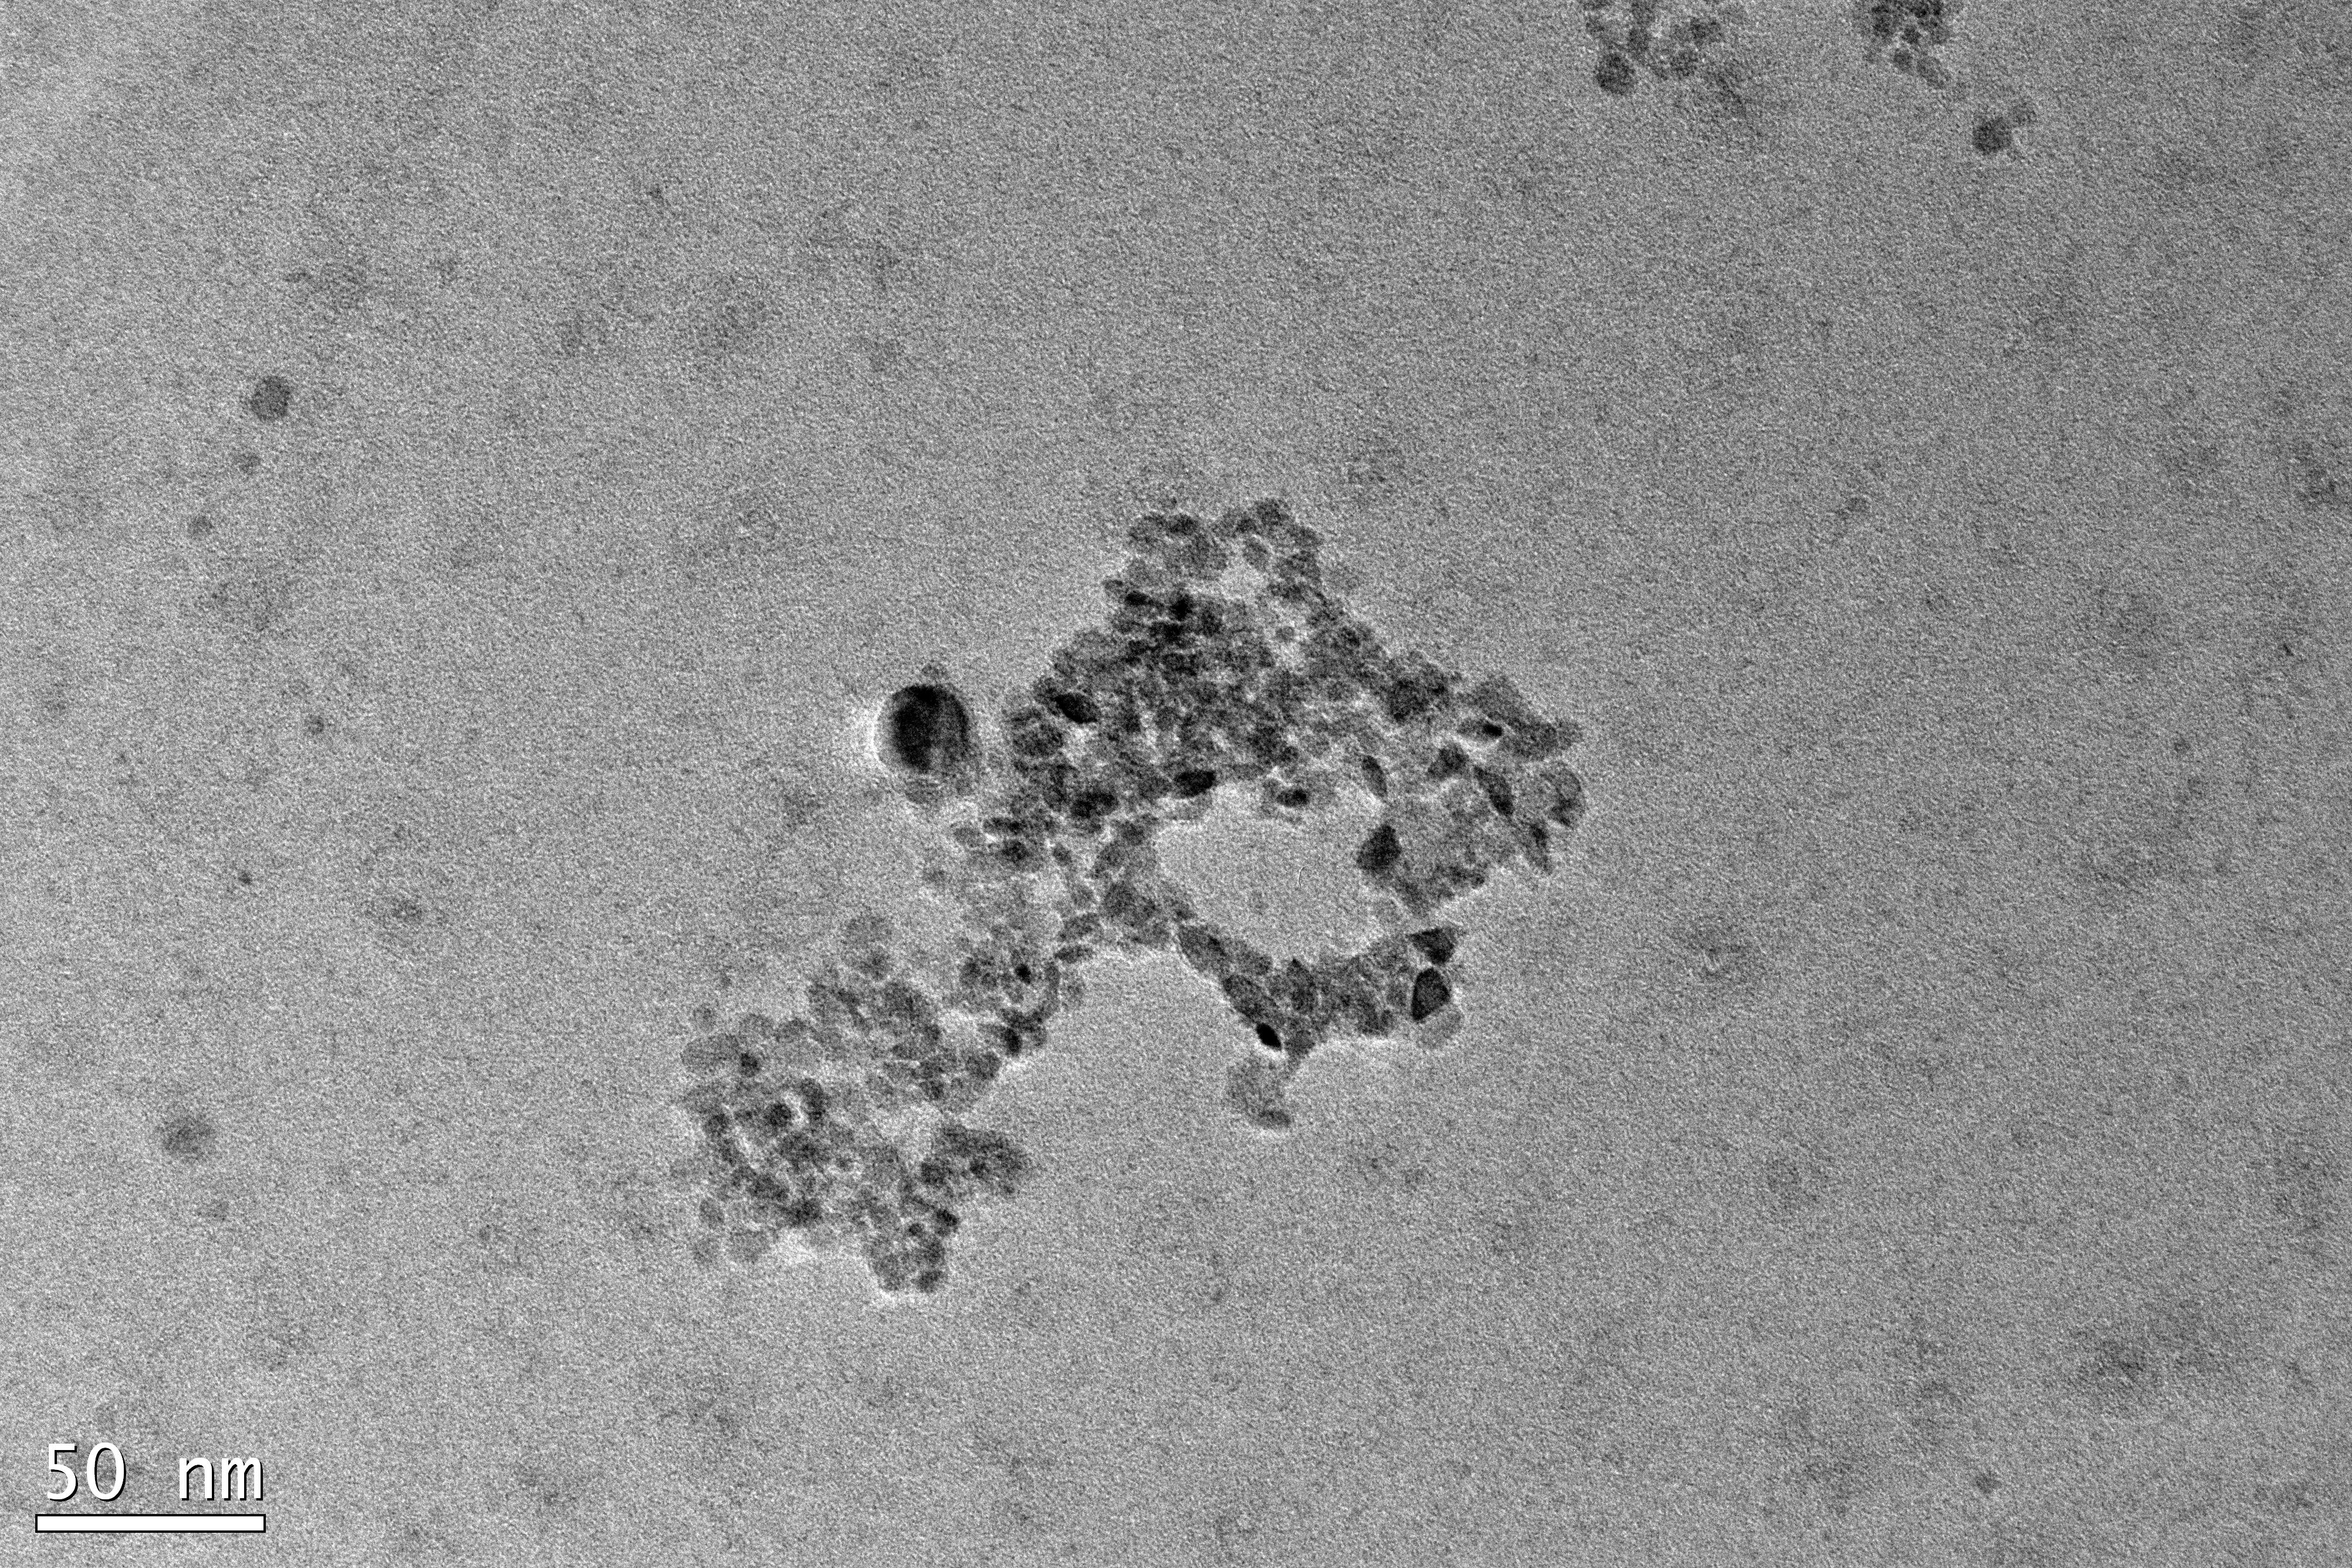
Table 4. The calculation of the particles number base on the data of Fig. 3.
| Size Interval, nm | After casting | After quenching treatment | After age treatment |
| 10~18 | 992497394 | 2977492184 | 13894963524 |
| 18~36 | 691818536 | 8578549852 | 6641457950 |
| 36~60 | 1255914129 | 2733460164 | 2068564448 |
| 60~96 | 395985027 | 677191785 | 499285469 |
| 96~140 | 182330845 | 207194142 | 179015739 |
| 140~200 | 76497246 | 81486197 | 67073672 |
| 200~300 | 37822757 | 33639595 | 33988192 |
| 300~430 | 11145202 | 6776731 | 8960966 |
| 430~620 | 3952345 | 2277303 | 3444186 |
Table 5. The number calculated of γ´ during the heat treatment based on data of Tab 3.
| The calculation based on | After casting | After quenching treatment | After age treatment |
| Mean Size, D, nm | 122350088 | 287452766 | 176619557 |
| Median Size, d50, nm | 158766713 | 524167173 | 256466366 |
4.3. Difference between TEM, pinpoint area, and X-ray, bigger test area, on nano of SCSA
Table 6. Elements were changing of γ´ powder during the treatment process from the spectrum of SEM.
| Element, Wt % | After casting | After quenching treatment | After age treatment |
| Al | 2.38 | 2.96 | 2.33 |
| Ta | 13.38 | 10.80 | 15.09 |
| Mo | 3.09 | 0.84 | 2.77 |
| W | 11.24 | 4.64 | 10.64 |
| Ti | 2.73 | 2.19 | 2.50 |
| Cr | 3.29 | 2.67 | 2.56 |
| Co | 3.29 | 4.14 | 3.30 |
| Ni | 60.60 | 71.77 | 60.81 |
Until now, the shortcoming of TEM on size distribution of nano particles had been discussed, and γ´ measurement of SCSA had already been completed in the name of sub-micro-sized and nano-meter-sized between statistics or accurate. Highlight again, based on the understanding that all particles of γ´ are in the same uniformity, and according the measurement from TEM about γ´ is L12-ordered FCC, the judgement of size distribution of nanoparticle had already completed by DDF model. Is the really in the unit state just like the result from TEM? How about nano structure, something like nanoparticles with core-shell structure? Here, the ratio of element was got, which would not do considered or discussed the shortcoming of the element measurement by SEM in this paper, was changing during the treatment in Tab.6. The result in Fig. 6 real discovered that there was do some fine changing in AM3 SCSA during the treatment process. According γ being considered as a disordered FCC phase, only cell parameters being changed during treatment, it could be regarded that some crystal structures were changed in γ´ during this process.
By Rietveld refinement method of XRD, the occupation of atoms and structural parameter of the specimens were studied. The results show that alloy powder in sub-micro-sized and nano-sized was a mixture of AlNi3 in ordered phase and disordered phase, and their crystallization was in a cubic structure belonging to the space group Pm3m and Fm3m respectively. In ordering phase, Al resides in site 1a at (0, 0, 0), and Ni in site 3c at (0, 1/2, 1/2). Meanwhile, in disordering phase, Al and Ni reside in the same site of 4a at (0, 0, 0). The quantitative analysis process was based on the relationship [14].
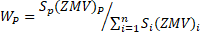
Here, Wp is the weight fraction of phase p in a mixture of n phases, and S, Z, M and V are Rietveld scale factor, the number of formula unit per cell, mass of the formula unit (in atomic mass unit) and the unit cell volume (in angstrom), respectively. The accuracy and reliability of the refinement, we will discuss in the follow, were verified by two parameters: Rp and Rwp.
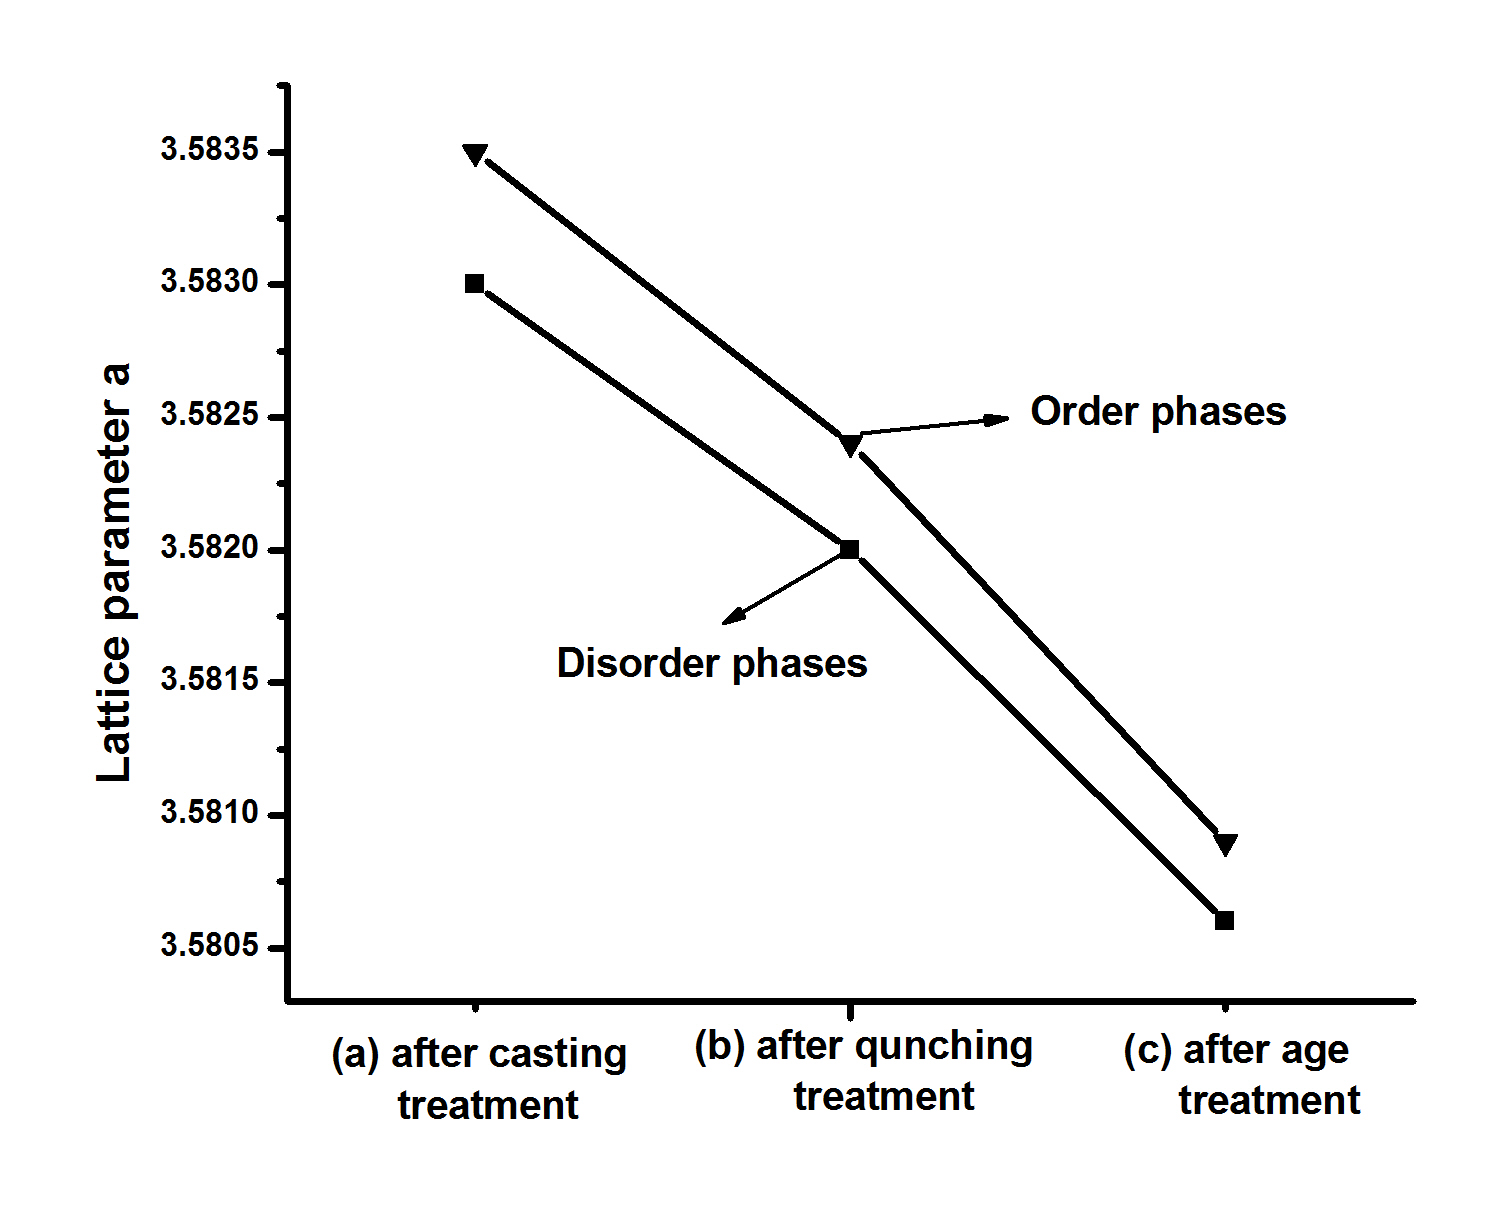
Table 7. Rietveld refinement results of the alloys powder, γ´ precipitates.
| Ratio of weight | After casting | After quenching treatment | After age treatment | |
| Order phase | 79.6% | 70.9% | 59.6% | |
| Disorder phase | 20.4% | 29.1% | 40.4% | |
| Quality factor | Rp | 6.338% | 5.573% | 6.303% |
| Rwp | 8.805% | 7.893% | 8.484% | |
Little known of the error influence about Cr-Co-Mo-W-Ti-Ta during the calculation, obviously, the results from Rietveld in this paper are very coarse, and are not good as its looking like although the Rp and Rwp in Tab. 7 with Fig. 8 are both good enough to be published in magazine. But, L12-ordered FCC, be published thousand times in papers and coming from the TEM, which can not been tested in all area of Fig. 9 even though the area is only in several hundreds micro-meter with the asymmetry of element, where the mis-orientation was not considered, whatever the milli-meter scale been considered too. The light area of TEM is too small and that of XRD is too large to calculate detail of the influence of Cr-Co-Mo-W-Ti-Ta so that many errors were covered. Lack of evidence proved that relationships among each atom in AM3 are less complex than fancy of author. So, this paper can’t describe them by TEM and SAXS.
So, what nano measurement in this paper is real looking for in AM3 SCSA by SAXS, and what nano measurement in this paper real looking for in nano power, and what real meaning or nature is looking for in papers published or will be published in future?
Nuclear fission and chain reaction are two supports of Einstein’s theory to change the world. The size of atom is around 1 Å, which equal to 0.1nm and diameter of U element is 3.4 Å, 0.34 nm. However, without chain reaction, which could not be measured by the pinpoint method, such as TEM, during explosion, nuclear fission in U metal is useless in World War II. What it is focusing in SCSA blade is nature, most of them is the statistic information here, some nano structures will be changing in L12-ordered FCC during anneal process, and atoms will be changing their location during using process, Fig. 8. Feynman’ lecture imaged to “arrange the atoms the way we want” in the past [15] and some scientists got Nobel Prise in 2016 by making small thing, molecular machines, at nano scale [16]. Although the things they got prize is bigger than one atom, no announcement from Nobel Committee or other institute shows that someone can measure informations of location, orientation, vibrate, velocity, and so on, and get separate results from every information of each different small molecular machines, total of them is over 25×108, until now. Although explosion and simulation calculation had been done about nuclear fission, it is also impossible to measure directly and get single information from every atom, location, orientation, vibrate, velocity, and so on, in situ in area over 50 𝝻m × 50 𝝻m, at least over 25×1010 atoms, by pinpoint measurement at the same time. Same thing even happens in Biology. It is usually regarded that the morphology and size of plant pollen and erythrocyte in blood is unified, there are no two same leaves in the world and no one research if there is some difference between two pollen at atom scale, and it is unfortunately to know that there are some DNA mutations in male sperm. Statistics from X-ray, could get the sum result for over area 50 𝝻m × 50 𝝻m, but with errors of each atom, tells what is look like, but not what is actual real look like about each atom in an AM3 SCSA blade, which just like the measurement of each star could not be done directly in a galaxy. As conclusion, at least until now, the directly situ measurement of SCSA about each atom and their nano structure information over micro-meter-size, or over the scale of decimeter or million-meter of a blade, is still impossible.
Table 8. Calculation of the discover probability by TEM.
| During 3 days and nights | ||||
| How long to measure one nano particle | 0.1 second | 1 second | 1 hour | 3 hours |
| Probability conclusion of proportion | 1/2592000 | 1/259200 | 1/72 | 1/24 |
| Particles be measured | 2592000 | 259200 | 72 | 24 |
How about things the size of nanoparticles, such as the size of nano powder of Ni, Si or SiO2? The crystal structure of γ´ was regarded as unified in this paper as some research. Here is a calculation about measurement of nano particles by TEM. It was said that a USA professor had a lecture in China and he said that it took him three days and nights to discover a nano thing in TEM, something like nano-bowl, to be published in paper. So, here is a table result to quantify his conclusion based on how long it takes him to discover one nano particle good enough to be published. And, the quantitation of his work just between proportion of 1/2592000 and 24 particles. The weight of these particles he had reported maybe less than one paper in the world is a quantitation result to his paper.
Indeed, that means only few of special case of SCSA on nano sacle could be surveyed. Furthermore, as the result of all these discussion and calculation, it should divide nano research of SCSA into two parts, discovery and quantitation. Based on weight of 0.75mg, length of 15mm, area of 15 mm ⨯ 10μm, 0.01169 mg γ´ particles be measured and test area by XRD, this paper should be regarded as a quantify paper with a discovery conclusion in Fig. 1 d), which indicated that there are small particles under 100 nm and the edge of big particles are coarse. All papers about nanoparticle only based on TEM should be regarded as discovery, and moreover, papers focusing on 70 nanoparticles only with size data from TEM should be regard as lack of repetitive on statistics information for nano powder. Based on different measurement and different measurement area, the feeling is very odd and very uncomfortable to announce two phases in one phase of L12-ordered FCC in the same one paper. They poison each other since that nano is a scale just between 1 Å and 0.1µm or 1 µm. But it had to be done that without another choice for reason that information was wanted, such as nuclear fission was researched and focused in a small scale and the using of chain reaction was also wanted more and more at the same time, about function of an AM3 SCSA blade, which is usually bigger than 100nm and at least cover from 1nm to 1µm or 1 mm. On the other hand, the size of destroyer in an AM3 blade maybe cover from nano-meter to milli-meter.
5. Conclusion
Although SAXS measurement was usually regarded as a tool used from 1nm to 100nm, and calculation process of it is very confuse and chaos, in this paper, the size distribution of γ` in SCSA of AM3 were measured by SAXS from nano to sub-micro. It proved that SAXS method is good enough for size measurement of nano particles with sub-micro particles. It also means that the publishing of a paper without statistic evidence, all particles in the paper are smaller than 100nm, should be very carefully avoided.
Second conclusion of this paper is that stop measure the size distribution of nano powder by TEM from 70 nanoparticles for the reason of lack of statistics, and the information from TEM or SEM can be done for the accurate discovery study of morphology for nanoparticle. In the past test of γ´ or other nano powder, Laser was regarded as a method for aggregation, not size of nanoparticles, especially for metal nanoparticles. Maybe, in some mono-dispersed nanoparticles system, it could test size of nanoparticles without aggregation phenomena.
The third conclusion of this paper is about discover and quantitation on nano topic of SCSA. The information from nano-meter scale to micro-meter scale, such as TEM and XRD, are both important although they might contaminate each other in the same one paper about SCSA. However, put them together. It is need to know that at least the awful data, such as 59.6% in 68.79%, was connecting with the safety quantitation of a flying plane. Conclusions from several atoms, pinpoint area, and from several millionmeters, a bigger test area than small one, are very important and necessary for quantitation of SCSA.
Acknowledgements
Thank the encouragement from diploma tutor, Professor W. M. Mao. It took me nearly 10 years and I regard them, Siyi Huang, Ludan Wang, Song Zhang and Shu Zheng, as co-completers with me.
We sincerely thank the help of P. Yan, J. K. Li, L. X. Li from Single Crystal Super Alloy Group and Central Laboratory of Central Iron & Steel Research Institute.
We had already given words thank you to J. Y. Zhang, CH. L. Liu and R. ZH. Zhu, for their work on SAXS measurement.
References
[1] F. I. Versnyder, M. E. Shank, “The development of columnar grain and single crystal high temperature materials through directional solidification,” Materials Science and Engineering, vol. 6, pp. 213-247, 1970. View Article
[2] S. Ma, D. Brown, M. A. M. Bourke, M. R. Daymond, B. S. Majumdar, “Microstrain evolution during creep of a high volume fraction superalloy,” Materials Science and Engineering, vol. 399, pp. 141-153, 2005. View Article
[3] K. Kakehi, “Effect of primary and secondary precipitates on creep strength of Ni-base superalloy single crystals,” Materials Science and Engineering, vol. 278, pp. 135-141, 2000. View Article
[4] O. H. Kriege, J. M. Baris, “The Chemical Partitioning of Element in Gamma Prime Separated from Precipitation-Handened, High-Temperature Nickel-Base Alloys,” American Society for Metals, 62, pp. 195-200, 1969. View Article
[5] J. Y. Zhang, C. L. Liu, “Particle size analysis -Small Angle X-ray scattering method,” Draft for Development of International Organization for Standardization (ISO), ISO/TS 13762:2001, Mar 2015, 2001.
[6] D. B. Wiles, R. A. Young, “A new computer program for Rietveld analysis of X-ray powder diffraction patterns,” Journal Applied Crystallography, vol. 14, pp. 149-151, 1981. View Article
[7] R. Gilles, D. Mukherji, M. Hoelzel, P. Strunz, D. M. Toebbens, B. Barbier, “Neutron and X-ray diffraction measurements on micro- and nano-sized precipitates embedded in a Ni-based superalloy and after their extraction from the alloy,” Acta Materialia, vol. 54, pp. 1307-1316, 2006. View Article
[8] Y. Zheng, “Analysis of nanoparticle size distribution using small angle X ray scattering,” In Proceedings of 3th International Conference on Nanotechnology: Fundamentals and Applications, Montreal, Canada, pp. 63, 2012.
[9] Y. Zheng, S. Huang, L. Wang, “Distribution analysis of nanoparticle size by Small Angle X-ray Scattering,” International Journal of Theoretical and Applied Nanotechnology, vol. 1, no. 1, pp. 124-133, 2012. View Article
[10] A. Guinier, X-ray Crystallography. London: Hilger & Watts Press, 1952.
[11] A. M. Brass, “SANS analysis of γ´ precipitation in the γ matrix of Ni base superalloy single crystals,” Scripta Mater, 43, pp. 913-918, 2000.
[12] A. Sasaki, “Size distribution analysis of nanoparticles using Small Angle X-ray Scattering technique,” The Rigaku Journal, vol. 22, no. 1, pp. 31-38, 2005. View Article
[13] Y. W. Xiang, J. Y. Zhang, C. L. Liu, “Verification for particle size distribution of ultrafine powders by the SAXS method,” Materials Characterization, vol. 44, pp. 435-439, 2000. View Article
[14] M. M. Islam, T. Sakurai, A. Yamada, S. Otagiri, S. Ishizuka, K. Matsubara, S. Niki, K. Akimoto, “Determination of Cu (In 1-x Ga x) 3 Se 5 defect phase in MBE grown Cu (In 1-x Ga x) Se2 thin film by Rietveld analysis,” Solar Energy Materials and Solar Cells, vol. 95, no. 1, pp. 231-234, 2011. View Article
[15] N. S. Husseini, D. P. Kumah, J. Z. Yi, C. J. Torbet, D. A. Arms, E. M. Dufresne, T. M. Pollock, J. W. Jones, R. Clarke, “Mapping single-crystal dendritic microstructure and defects in nickel-base superalloys with synchrotron radiation,” Acta Materialia, vol. 56, pp. 4715-4723, 2008. View Article
[16] Wikipedia, “There’s Plenty of Room at the Bottom” [Online]. Avilable: https://en.wikipedia.org/wiki/There%27s_Plenty_of_Room_at_the_Bottom
[17] Nobel Committee, The Nobel Prize in Chemistry 2016 [Online]. Avilable: https://www.nobelprize.org/nobel_prizes/chemistry/laureates/2016/