International Journal of Theoretical and Applied Nanotechnology (IJTAN)
ISSN: 1929-1248

Volume 1, Issue 1, Year 2012 - Pages 117-123
DOI: 10.11159/ijtan.2012.018
Towards an Integrated and Adaptive Risk Assessment Tool for Engineered Nanoparticles
Julien Fatisson1, Stéphane Hallé1, Sylvie Nadeau1, Barthélemy Ateme-Nguema2, Nabil Nahas3, Claude Viau4, Michel Camus5, Yves Cloutier6
1École de Technologie Supérieure, Montréal, Canada
julien.fatisson@etsmtl.ca; stephane.halle@etsmtl.ca; sylvie.nadeau@etsmtl.ca
2Université du Québec en Abitibi-Témiscamingue, Rouyn-Noranda, Canada,
barthelemy-hugues.ateme-nguema@uqat.ca
3Université Laval, Québec, Canada
nabil_nahas@hotmail.com
4Institut de recherche en santé publique de l'Université de Montréal, Montréal, Canada
claude.viau@umontreal.ca
5Université de Montréal, Montréal, Canada
michel.camus@umontreal.ca
6Institut de recherche Robert Sauvé en santé et sécurité du travail, Montréal, Canada
cloutier.yves@irsst.qc.ca
Abstract - An original and innovative approach to assess the risks associated to engineered nanoparticles is presented. The primary observations from the literature review are discussed and point out the interdependency of most risk factors. This sole fact justifies the need for an adequate analytical model to ensure a proper risk management for the development of an adaptive decision-making tool. With this objective, optimization-based modelling tests were first conducted in order to validate the feasibility of the method.
Keywords: Engineered Nanoparticles, Risk Assessment, Risk Management, Decision Supports
© Copyright 2012 Authors - This is an Open Access article published under the Creative Commons Attribution License terms. Unrestricted use, distribution, and reproduction in any medium are permitted, provided the original work is properly cited.
1. Introduction
Engineered nanoparticles (ENPs) present new chemical, physical or biological properties that could be used in numerous applications. They hold the promise of a new medical and industrial revolution. Lux Research reports that the value added by nanotechnologies to manufactured products is expected to reach $3.4 trillion U.S. in 2015 (Lux Research 2009). In 2011, all sectors taken together, Nanowerk (Web-1) listed 1,168 commercial organizations in nanotechnologies in the US and 86 in Canada. This means that, while the market is growing, the risk of unintentional or accidental contact of nanomaterials with workers is increasing as well. Still many uncertainties surround the risks posed by ENPs (Kandlikar et al. 2007).
The list of factors that make ENPs harmful to humans has not been completed yet. We do not know all the mechanisms that could make them toxic, or which of their chemical and physical characteristics are involved in such mechanisms (Hansen 2009 and European Commission 2007). Considerable knowledge is rapidly being developed to understand these aspects by interdisciplinary teams. However these teams are using different methodological approaches and materials derived from various sources, making it very difficult to use their combined results to guide risk management strategies. Indeed, testing and standards classification are lacking (Balbus et al. 2006). Only recently were standard criteria proposed by the European Commission to define nanomaterials (Web-2). Meanwhile, organizations, such as the Environmental Protection Agency (Web-3), the World Health Organization (Web-4) with resolution II/4, or the European Commission with the REACH framework (REACH 2006), have begun to propose safety recommendations for the use and production of nanomaterials.
Given the speed at which nanotechnologies are developing, new risk assessment and management methods are required (Nadeau et al 2012). As emphasized by Aitken et al. (2004), actual risk evaluation methods are inadequate and require better use of the data available as well as the acquisition of new data. Recently, Nadeau et al. (2012) clearly expressed the need for an adaptive or flexible risk management strategy. As a continuation of our objectives to manage the risks posed by ENPs in the workplace environment, we are currently studying a prototype model to address the questions raised by their manipulation by prioritizing several risk factors. By using this model to develop an adaptive decision-making tool, it seems essential that the stakeholders can appreciate the risks posed by ENPs. Qualitative or quantitative risk evaluation is, by itself, a difficult task from an analytical perspective. Given the complexity of the ENPs risk assessment, the development of an organized risk network needs presently the modelling of many parameters currently quantifiable or not, and even factoring in yet unknown factors and parameters.
Particle swarm optimization (PSO) is an intelligent optimization algorithm, originally proposed by Kennedy and Eberhart (1995). It is inspired by social behaviour among individuals (i.e. particles). PSO algorithm can be used to solve complex optimization problems and it can be implemented easily with few parameters to tune. PSO algorithm has been applied successfully in many areas like antenna design (Boeringer and Werner 2004; Khodier and Christodoulou, 2005), biomedical (Selvan et al. 2006), image and video (Wachowiak et al. 2004) and others. PSO was therefore first chosen and tested for the development of a decision-making tool for the risk management of ENPs. To apply the PSO algorithm to discrete optimization problems, it should be adapted. Many versions of the discret PSO are proposed in the literature. The first was proposed by Kennedy & Eberhart (1997) where particles were encoded as binary sequences. Particle trajectories and velocities were defined as probabilities of a bit change from 0 to 1. In Hu et al. (2003), the velocity is defined as a vector of probabilities in which each element corresponds to the probability of exchanging two elements of the permutation vector that represents a given particle position. Wang et al. (2003) presented a new application of PSO algorithm for Traveling Salesman Problem (TSP). The authors developed some methods for solving TSP by using the concept of Swap Operator and Swap Sequence. Clerc (2004) proposed another version of discrete PSO where velocity is defined as a list of pairs of indexes of the permutation vector elements which will be exchanged. More recently, Fan (2010), inspired by the "swap operator" developed in (Wang, 2003), redefined velocity and added an heuristic factor, a crossover operator and an adaptive noise factor into the discrete PSO algorithm.
2. Method
Since epidemiological studies of nanoparticles are so sparse, we preferred the approach an a priori, which estimates the possible associations between causes and consequences before undesirable events occur. Before applying risk management to decision-making tools, we first needed to identify all the risk factors associated with ENPs. Consequently, the critical literature review examines the following questions: What are all the risk factors inventoried to date? What are the known links between these risk factors? Which ENP property poses more risk in a given situation?
In a first step, using PubMed data base and SciFinder Scholar research Tool, we conducted a systematic literature review for the years 2001 to 2011 using the following keywords: nanoparticle, nanomaterial, risk, uncertainty, risk management, risk assessment, in various combinations. To focus the process, review articles and commission reports (for examples OECD or European commission) were first selected and research articles were subsequently taken into consideration. References cited in these papers were used to identify additional studies (also published in the 2001-2011 period). All risks factors (such as primary particle size, particle morphology or catalytic properties) and effects (cell uptake or dose-responses relationship) were therefore identified. After Step 1, we classified these factors under three different levels (Step 2). First, each factor was categorized whether it was associated to an intrinsic parameter, to a transfer to the target (exposure) or to a harmful effect (level-1). Then, a level-2 classification was subsequently applied to all the factors identified in the literature depending if the factor corresponds to an intrinsic, interfacial or mobility-related property or if the exposure was due to the task of the environment or if the effect was more related to physiological conditions or cell-specific or another harmful effect (Table 1). Finally, some factors, for example the size distribution, the primary size or the mean size, were regrouped into a level-3 classification (i.e size in the example). Then, in a third step, using specific keywords corresponding to each risk factor listed, we identified all observed links between all individual risk factors (Step 3). All observations and data from this review were further compiled and structured for the identified risk factors and links between risk factors in a form of a risk tree (Step 4). Finally, a matrix format of the tree was created for Particle Swarm Optimization (PSO) algorithm and preliminary results were obtained and are presented (Step 5).
The objective of an influence diagram, commonly referred as a risk tree, is to represent cause-consequence associations existing between various elements of risk, in a graphical form. A fault tree is a logical diagram that shows the relationships leading to an undesirable event. This approach is easy to use, favours systematic search for causes and their associations and does not require chronological relations between risk factors and effects. As will be described in greater detail below, fault trees as defined were converted to a hierarchized risk network. Arrows between elements of risk (Fig. 1) indicate cause-consequence associations; the arrow heads indicating which element is influenced or that influence is mutual.
The ENPs risk prioritization can be viewed as an optimization approach, tending to reduce the ENPs occurrence probability and their impact on human health. Every factor keeps a relationship with others, as concluded from the risk hierarchization. Finding out a feature model in which all factors maintain maximal relationships with each other is a typical combinatorial optimization problem (Zhu and Xiao-ping, 2009) which can be solved by metaheuristics. In the PSO algorithm, each solution (i.e. particle) is considered as a bird in the search space. Every particle has a velocity by which the direction and distance of the flying are determined, and a fitness that is obtained by the optimized function. At the beginning, a set of random particles (i.e. solutions) is generated, and the corresponding fitness values are determined. At each iteration, two values are updated for every particle. The first value corresponds to the best personal solution, and the second corresponds to the global best solution found by the population.
3. Primary Results and Discussion
3.1 Literature Review
With over 100 different documents selected (table not shown), step 1 could allow the identification of 100 potential risk factors associated to ENPs in an occupational safety context. A first categorization of these factors was then carried out (i.e. size, shape, room humidity, cellular uptake, etc.), therefore creating 34 primary factors (level-3 classification) where all 100 secondary factors were sub-listed. For example, physical properties include catalytic, magnetic, thermal, electrical properties, etc. These 34 primary factors were classified as hazard, exposure or effect factor, giving 15 hazard factors, 9 exposure factors and 12 possible effects (Table 1). A recent review by Grass et al (2010) demonstrated that nanospecific risks could be categorised under 3 groups: mobility, interface and quantum effects. This classification method was then applied to the 34 primary factors listed in order to create 8 major groups (level-2): intrinsic properties, interfacial properties, mobility, ambient exposure, task-related exposure, global toxic effects, cellular toxic effects and other harmful effects (step 2).
By using the 34 primary factors, a second literature review was carried out to establish the known links between these factors. Again, recent reviews were first considered leading to the analysis of references. Each article underlining a link between 2 factors was listed, with emphasis on the ENP type (TiO2, silver, carbon nanotubes, fullerenes, etc.) for which the link was established (step 3).
The results obtained in steps 1 to 3 allowed the creation of a graphic and a matrix-like (data not shown) structure of a risk tree (step 4) for the 34 "primary" factors, then for the 8 major groups (Fig. 1). The arrows appearing between each category represent the known links based on the literature.
Table 1. Three levels based classification.
|
Level-1 |
Major groups (level-2) |
Primary factors (level-3) |
|
Risk factor |
Intrinsic properties |
Size, Surface area, Shape, Chemical composition, Physical properties, Method of synthesis, Fibrosity, New product? |
|
Interfacial properties |
Surface charge, Surface chemistry, Reactivity, Degradation/Transformation |
|
|
Mobility properties |
Media-dependent behaviour, Agglomeration/Disagglomeration behaviour, Dustiness/Mistiness, Deposition behaviour |
|
|
Transfer to the target |
Ambient exposure |
Exposure route, Environmental conditions, Used with other products |
|
Task-related exposure |
Concentration, Task/Operation |
|
|
Effect |
Physiological toxic effects |
Inflammatory response / Immunotoxicity, Toxicokinetics (ADME), Toxicodynamics and biovailability, Clearance/Migration/Translocation ability, Reproductive toxicity / Teratogenicity, Dermal/Ocular toxicity, Neurotoxicity |
|
Cell-specific toxic effects |
Cell viability, Cellular uptake Carcinogenicity/ Mutagenicity (clastogenicity), Genotoxicity (Aneugenicity), Long term effects, Dose-response |
|
|
Other harmful effects |
Explosivity, Combustibility and Inflammability |
Arrows between elements of risk (Fig 1) may indicate cause-consequence associations (unidirectional arrows) or if the influence is mutual (bi-directional arrows).
Moreover, it was already noted that a great number of research reports highlighted the influence of ENPs intrinsic properties (size in particular) on the different physiological toxic effects, while just fewer studies focused on the link between ENPs mobility and their other harmful effects, such as their flammability. This enumeration was not exhaustive since several reviews of the literature have reached the conclusion that this would be a colossal task. However, the bare number of studies discussing a factor is not necessarily a reliable indicator of its importance. As a matter of fact, certain characterizing and testing techniques were not available 10 years ago. For example, it was easier to measure the size of nanoparticles using microscopy than to conduct real-time analysis of particle agglomeration rates in matrices identical or nearly identical to those used in cytotoxicity tests. Therefore a careful and detailed analysis of the each article describing the links between each of the 34 factors is definitely needed in order to validate the results obtained by the model. Meanwhile, preliminary calculations with optimization methods (such as PSO) was conducted to estimate the importance of level-3 primary factors.
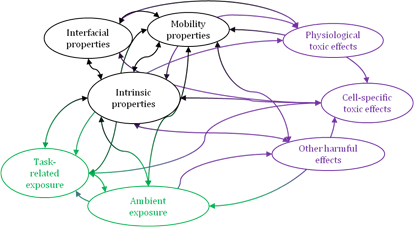
Fig. 1 can be considered as representative of the current knowledge regarding the risks associated to ENPs. The main observation of this complex structure is that all parameters are interdependent. Several remarks can be made:
It is difficult to extract or study one parameter specifically and independently from the others. Consequently, care must be taken regarding the interpretation of the results of each of these studies.- Therefore, it reinforces the need for standardization of the methods, the tests and the materials usable for these tests.
- Case-by-case analysis, which was previously pointed out as an alternative, may not be considered. The task appears colossal even impossible without a standard method approved by the scientific community. The solution of the « puzzle » is far from simple and most probably needs a specific and adequate analytical model.
- Few relationships involving exposure factors have been established in the literature
A similar analysis was completed by Morgan (2005). The risk tree that was developed at that time can be compared to the one we are proposing now and one can first conclude that the situation has rapidly and significantly changed over the last 6 years as new risk factors and new links appeared. As introduced by Grass et al. (2010), this can be associated to the fast and continuous growth of research and consumer products.
In contrast with the work of Morgan (2005) based on consultation of experts, our review is based on literature published between 2001 and 2011. The lack of extensive scientific data, noted by Morgan (2005), should now be re-examined. The number of studies published on the subject of nanotechnologies and their effects on health has grown exponentially. Based on PubMed, the number of publications matching keywords such as ultrafine particles or nanoparticles plus toxicity or effects on health was 5 in 2001, 246 in 2006 and 1516 in 2011.
One of the aims of the present article was to produce a brief list of ENP-associated first-line risks, in other words focused specifically on the protection of workers. Another aim was to present the relative relevance of existing relationships between the various elements of risk, as reflected by the great number of studies published during the period of interest. We thus note in particular, by way of simplified comparison, that certain categories of risk have been regarded in the scientific community as more important than others seemingly equally deserving of in-depth study, such as exposure categories.
As evidenced by the hierarchized risk network, presented in Fig. 1, the interdependency between each factor confirms the need for an adaptive risk management method as the most promising solution facing the rapidly challenging development of nanotechnologies.
A few tests with multi-criteria methods (Linkov et al 2011; Zuin et al 2011) were performed but this efficient and simple method has its limits. Since the risk assessment for ENPs brings uncertainties of a structural nature, techniques that are more suited for uncertain decisional environments are needed (Nadeau et al. 2012). Using metaheuristics to classify the risks associated to ENPs presents several advantages. The first is that these methods are classified whether they end up to a single or multiples solutions, as the characterization of an ENP requires a reasonable opening of the possible solutions. Secondly, ENPs classification refers to the resolution of an optimization problem, which tends to reduce the occurrence probability associated to the ENP and its possible impact on human health. Called "combinatory optimization", it consists in finding the best solution among a high but finite number of potential choices. PSO (Dréo et al. 2005) is one possible approach that offers flexibility in its use and implantation.
3.2 Optimization Results
As a first step towards a complex optimization of our review results, we decided to consider only a part of all 100 secondary factors. Our choice was first directed to the factors having an influence on the mobility properties, namely the factors behind the intrinsic, interfacial properties and the ambient and task-related exposure categories. These factors factors presented showed in Table 2.
Table 2. List of 3rd level category factors chosen for the first optimization test.
|
D1 |
Size |
Intrinsic properties |
|
D3 |
Surface area |
|
|
D6 |
Shape |
|
|
D9 |
Chemical composition |
|
|
D11 |
Physical properties |
|
|
D14 |
Method of synthesis |
|
|
D21 |
Fibrosity |
|
|
E6 |
New product? |
|
|
D2 |
Surface charge |
Interfacial properties |
|
D4 |
Surface chemistry |
|
|
D5 |
Reactivity |
|
|
D10 |
Degradation/Transformation |
|
|
E2 |
Exposure route |
Ambient exposure |
|
E3 |
Environmental conditions |
|
|
E5 |
Used with other products |
|
|
E4 |
Concentration |
Task-related exposure |
The relationships between each of the risk factors listed in Table 2 have not been quantified yet in the literature. Such a quantification can be achieved by further steps such as expert elicitation or meta-analysis. Therefore, for the purpose of validating the use of PSO to our hierarchized network, random values were assigned to the relationships between each factor. However, in order to estimate the relative importance between factor i and j regarding their impact on the mobility properties, a primary 2-by-2 comparison of the factors was first carried out with "1"s for important and "0"s for negligible. Then, when the relationship between factor i and j was considered important, the values d(i,j) (i,j=1,..17) (Table 2), referring to the relationship between each factor with the others, are generated randomly between 5 and 50 (data not shown). The smaller d(i,j) is the closer relationship factor i has with factor j. When the relationship is considered negligible, the d(i,j) value was affected to the letter M. In this paper M is set to 50.
The problem can be seen as a graph with a completely connected network in which each influencing factor is considered as a node and the relationship between each couple of factors is viewed as an edge. In our case, the graph is formed with 17 nodes. The objective is to search an influencing factor model with the maximal contribution and relationship in graph. To solve this problem, we adopted the discrete PSO algorithm of (Fan 2010) and applied it to the matrix formed by the risk factors in Table 2. With less than 10000 iterations, the most influencing factors are given by Table 3.
From Table 2, one can see that surface charge and surface area (equally with task and operation) are the most influencing factors towards the mobility properties, as a whole factor, with scores of 0.578 and 0.412 respectively. Since the d(i,j) values were randomly selected, this ranking cannot be considered as definite. However, these results confirm that discrete PSO is definitely fast and suitable for such a system and that with d(i,j) values extracted from expert elicitation or meta-analysis, it is possible to obtain reasonable results for the ranking of ENPs risk factors. One can also note that the three most influencing factors belong to three distinct categories: intrinsic properties, interfacial properties and task-related exposure. Moreover, the former two categories are amongst the categories that received the most attention by the research community by describing the links and influences between them. This observation emphasizes on the interdependency between all categories, as evidenced by Figure 1. The results from PSO are based on actual data and reviews and expected to change and go into much details with future research.
Table 3. Contribution of each factor.
|
Factor |
Contribution |
|
D2 |
0.578 |
|
D3 |
0.412 |
|
E7 |
0.412 |
|
E4 |
0.361 |
|
D6 |
0.321 |
|
D9 |
0.321 |
|
E2 |
0.289 |
|
D5 |
0.262 |
|
D4 |
0.262 |
|
D11 |
0.222 |
|
D1 |
0.222 |
|
E5 |
0.222 |
|
D21 |
0.125 |
|
E3 |
0.120 |
|
D10 |
0.111 |
|
D14 |
0.057 |
|
E6 |
0.057 |
4. Conclusion
The main conclusion of the literature review is that it is nearly impossible to study one parameter independently from all the others owing to the reciprocal influence they have on each other. Given the considerable number of reports and ENPs available on the market, comparison is also very difficult without standardization (methods and testing). However, a promising approach to bring solutions to decision makers can be brought by developing an adaptive tool that will allow the stakeholders to propose control measures efficient enough to protect the workers.
Since future steps in the development of this innovative decision-making tool involve expert judgement analysis, toxicological test results and field data, we needed to choose a widely used material. Moreover, in view of the multiplicity of ENPs and the complexity of the system, as presented in Fig.1, the use of one specific ENP is needed to design and test the future prototype before extending the applicability of our tool to other nanomaterial. Therefore, based on the abundant available literature and the feasibility of future toxicological tests, TiO2 particles were selected for the next tool development steps and will allow ultimately the development of a tool usable for any ENP as needed by the stakeholders. Consequently, this study is a first step towards risk management but cannot be used as a ranking tool in its present form since future optimization steps are needed.
Moreover, since PSO is not the only optimization method for modelling such a system, results from other techniques will be further compared in order to choose the most suitable technique for the development of our adaptive decision-making tool.
Acknowledgements
This work is supported by the Knowledge Network Ne3LS and the Réseau de Recherche en Santé et Sécurité du Travail du Québec (RRSSTQ).
References
Aitken, R., Creely, K., Tran, C. (2004) Nanoparticles: An occupational hygiene review. Institute of Occupational Medicine, Contract No.: Research Report 274. View Article
Balbus, J. M., Florini, K., Richard, A. D., Scott, A. W. (2006) Getting it right the first time: developing nanotechnology while protecting workers, public health, and the environment. Annals of New York Academy of Science, 1076, 331-342. View Article
Boeringer, D., Werner, D. (2004) Particle swarm optimization versus genetic algorithms for phased array synthesis. IEEE Transactions on Antennas and Propagation, 52(3): 771–779. View Article
Clerc, M. (2004) Discrete particle swarm optimization, illustrated by the traveling salesman problem. New Optimization Techniques in Engineering, Springer, pp. 219–239. View Article
Eberhart, R., Kennedy, J. (1995). A New Optimizer Using Particles Swarm Theory, Roc. Sixth Intemational Symposium on Micro Machine and Human Science (Nagoya, Japan) IEEE Service Center, Piscataway, NJ:39-43 View Article
European Commission (2007) 1st Annual Nano Safety for Success Dialogue. Community Health and Consumer Protection. Brussels, October 25 and 26. View Article
Fan, H. (2010) Discrete Particle Swarm Optimization for TSP based on Neighborhood. Journal of Computational Information Systems 6(10): 3407-3414 View Article
Grass, R. N., Limbach, L. K., Athanassiou, E. K., Stark, W. J. (2010) Exposure of aerosols and nanoparticles dispersions to in vitro cell cultures: A review on the dose relevance of size, mass, surface and concentration. Journal of Aerosol Science, 41, 1123-1142. View Article
Hansen, S. F. (2009) Regulation and risk assessment of nanomaterials. Too little, too late? Ph.D. Thesis. Department of environmental engineering. Technical University of Denmark. View Article
Hu, X., Eberhart, R. C., Shi, Y. (2003). Swarm intelligence for permutation optimization: A case study of n-queens problem, Proceedings of the 2003 IEEE Swarm Intelligence Symposium, Indianapolis, USA, April 2003, pp. 243-246. View Article
Kandlikar, M., Ramachandran, G., Maynard, A. D., Murdock, B., Toscano, W. A. (2007) Health Risk Assessment for Nanoparticles: A Case for Using Expert Judgment. Journal of Nanoparticle Research, 9, 137-156. View Article
Kennedy, J., Eberhart, R. C. (1997) A discrete binary version of the particle swarm algorithm. Systems, Man, and Cybernetics, 'Computational Cybernetics and Simulation'., IEEE International Conference 5: 4104–4108 vol.5. View Article
Khodier, M., Christodoulou, C. (2005) Linear array geometry synthesis with minimum sidelobe level and null control using particle swarm optimization. IEEE Transactions on Antennas and Propagation, 53(8): 2674–2679, 2005. View Article
Lux Research (2009) The recession's ripple effect on nanotech: State of the market report. New-York, Lux Research inc., June 9. View Article
Linkov, I., Bates, M. E., Canis, L. J., Seager, T. P., Keisler, J. M. (2011) A decision-directed approach for prioriting research into the impact of nanomaterials on the environment and human health. Nature Nanotechnology, 6, 784-787. View Article
Nadeau, S., Hallé, S., Viau, C., Cloutier, Y. (2012) Call for the development of an adaptative too for assessing human health posed by engineered nanoparticles. International Journal of Safety and Security Engineering, 2(1), 40-53. View Article
Morgan, K. (2005) Development of a preliminary framework for informing the risk analysis and risk management of nanoparticles. Risk Analysis, 25(6), 1621-1635. View Article
Registration, Evaluation, Authorisation and Restriction of Chemicals (REACH) (2006). Brussels, Belgium: European Commission, 2006 December 30th. Report No.: Contract No.: 1907/2006. View Article
Selvan, S., Xavier, C., Karssemeijer, N., Sequeira, J., Cherian, R., Dhala, B. (2006) Parameter estimation in stochastic mammogram model by heuristic optimization techniques. IEEE Transactions on Information Technology in Biomedicine, 10(4): 685–695. View Article
Wachowiak, M., Smolikova, R., Zheng, Y., Zurada, J., lmaghraby, A. (2004) An approach to multimodal biomedical image registration utilizing particle swarm optimization. IEEE Transactions on Evolutionary Computation, 8(3): 289–301. View Article
Wang, K. P., Huang, L., Zhou, C. G., Pang, W. (2003) Particle swarm optimization for traveling salesman problem. Proceedings of the International Conference on Machine Learning and Cybernetics, pp 1583–1585. View Article
Zhu, J., Xiao-ping, M. (2009) Safety evaluation of human accidents in coal mine based on ant colony optimization and SVM. Procedia Earth and Planetary Science, 1, 1418-1424. View Article
Zuin, S., Micheletti, C., Critto, A., Pojana, G., Johnston, H., Stone, V., Tran, L., Marcomini, A. (2011) Weight of Evidence approach for the relative hazard ranking of nanomaterials. Nanotoxicology, 5(3), 445-458. View Article
Website References
Nanowerk. Databases/Company and Labs Directory. Consulted January 2012. View Website
Report of European Commission for a definition of nanomateials. Consulted January 2012. View Website
PA. Control of Nanoscale Materials under the Toxic Substances Control Act. Washington, DC2011, Cited 25 July 2012 View Website
WHO. ResolutionII/4 on Emerging Policy Issues. 2009-2010, Cited 25 July 2012 View Website