International Journal of Theoretical and Applied Nanotechnology (IJTAN)
ISSN: 1929-1248

Volume 1, Issue 1, Year 2012 - Pages 66-72
DOI: 10.11159/ijtan.2012.010
Preparation of Pulse Deposited Pt/Ni Nanowires Electrode for Glucose Detection in Alkaline Solution
Sahar Sadat Mahshid1,2, Sara Mahshid1,2, Abolghasem Dolati1, Mohammad Ghorbani1, Lixia Yang3, Shenglian Luo, Qingyun Cai4
1Sharif University of Technology, Department of Materials Science and Engineering
Tehran, Iran, 11155-9466
dolati@sharif.edu; ghorbani@sharif.edu
2Monash University Sunway Campus, School of Mechanical Engineering,
Jalan Lagoon Selatan
46150, Bandar Sunway, Selangor, Malaysia
sahar_mahshid@yahoo.com; sara.mahshid@monash.edu
3Nanchang Hangkong University, School of Environment and Chemical Engineering
Nanchang, China, 330063
yanglixia829@163.com
4Hunan University, State Key Laboratories of Chemo/Biosensing and Chemometrics, Department of Chemistry,
Changsha, China, 410082
sllou@hnu.cn; qycai0001@hnu.edu.cn
Abstract - The development of an amperometric non-enzymatic electrode based on alloyed Pt/Ni nanowire arrays (NWAs) was described. The effect of pulse time on the fabrication of uniform nanowires was investigated by Scanning Electron Microscopy (SEM). In this regard, the pulse time had been designed in a way that the diffusion controlled deposition of metallic ions inside the pores had enough time to take place and uniform structure of nanowires was created. The resulting Pt/Ni NWAs electrode displayed good electro-catalytic activity for oxidation of glucose in alkaline solution. The impact of combination of Pt and Ni in a nanowire arrays electrode in comparison to individual Pt or Ni as nanowires has been studied by cyclic voltammetry in a wide range of potential scan. The amperometric response characteristics to glucose in 0.1 M NaOH solution were reported as low overpotential of 0.45 V vs. SCE, amperometric response time of almost 3 s, linear concentration range extended from 2 to 8 mM (R = 0.997), with 1.5 μM detection limit. Furthermore, the oxidable species such as ascorbic acid and uric acid showed no significant interference in determination of glucose.
Keywords: Pt/Ni Nanowires; Non-Enzymatic, Glucose; Amperometric Response
© Copyright 2012 Authors - This is an Open Access article published under the Creative Commons Attribution License terms. Unrestricted use, distribution, and reproduction in any medium are permitted, provided the original work is properly cited.
1. Introduction
Metallic nanowires have recently attracted much attention, because of unique physical and electrical properties and potential applications in nanoelectronics devices, nanosensors and catalysts. Among different type of sensors, glucose sensor is extremely important in diabetes patients because the neural complication is directly related to the magnitude of chronic elevations of blood glucose (Turner et al., 1999; Newman et al., 2005; Chu et al., 2007). Until now, the enzymatic glucose sensors based on glucose oxidase (GOx) have been recognized as a fast and reliable one (Honda et al., 1997; Wilson and Gifford, 2005; Zhang et al., 2007; Musameh et al. 2008; Shervedani et al., 2006). However the most important problem is the insufficient stability and loss of enzyme activity during immobilization process (Newman et al., 2005). Therefore, the development of non-enzymatic glucose sensors has received great attentions. Different metals such as platinum, gold and their alloys have been explored as electrode materials to develop non-enzymatic glucose sensors (Turner et al., 1999). The potential applications of Pt have been demonstrated in the fields of biosensors, catalysts and fuel cells. In particular, its stability in electrochemical reactions and its prominent catalytic activities are most attractive for the fabrication of sensors (Safavi et al., 2009). On the other hand, the nickel electrode has also been the most widely utilized non-enzymatic electrode for determining glucose in alkaline media and the electrochemical property of metallic nickel electrode, nickel nanoparticles and nanowire arrays of nickel have been well investigated. Alloy catalysts with various transition metals were employed to increase the catalytic activity and to reduce the cost. Various Pt-based alloy catalysts (binary, ternary and quaternary alloy) have been tested for last two decades. Many researchers have reported that Pt-based alloy catalysts showed higher activity than Pt-alone (Min et al., 2000). Many works have reported that some Pt-based alloy catalysts show higher activity than Pt-alone, and this has been ascribed to changes in the Pt-Pt bond distance and Pt electronegativity, electron density in the 5d Pt orbital, and surface oxide layers (Lima et al., 2006; Park et al., 2002).
Therefore, employing the bi-metallic catalysts such as Pt and Ni can improve the sensor application. The application of Pt-Ni alloy in fuel cell has been reported previously (Qu et al., 2007; Lu et al., 2009). However, according to our knowledge there is no report on combination of the two metals as Pt/Ni nanowires in sensor application. In our recent work (Mahshid et al., 2011a), the Pt/Ni nanowire electrode was introduced as glucose sensor in the range up to 2mM glucose concentration. However, in this work, a wide arrange up to 10 mM glucose was tested and reported for the proposed electrode.
2. Experiments
The PC template (200 nm pore diameter and 6 μm thickness, Whatman Ltd.) was first sputtered with a film layer of gold and then attached gold-side down on the glassy carbon (GC – 4 mm diameter) electrode. Pt and Ni were electrodeposited on the PCT by an amperometric pulse method in a standard three-electrode cell with the modified GC as working electrode, a Pt foil as counter electrode and a saturated Calomel electrode (SCE) as reference electrode. Each pulse was consist of two deposition steps of -1.5 and -0.35 V vs. SCE with deposition time of 1 and 5 s, respectively. The precise deposition condition and electrolyte composition has been reported elsewhere (Mahshid et al., 2011a). After deposition, the PC template was dissolved by immersing the electrode in Dichloromethane. The resulting GC electrode modified by Pt/Ni NWs was washed with deionized water and then checked for the catalytic activity in the supporting electrolyte of 0.1M pH 13 NaOH buffer solution. CV method together with the i-t transients technique were utilized for detection of glucose (Gl). The CVs, amperometric pulse deposition and i-t transients for the catalyst measurements were carried out by CHI660B (CH Instruments. Inc., Austin, TX), an electrochemical working station. Solutions of glucose were prepared daily using double distilled water and then were directly used for the detection. The morphological characterization of samples was examined using a scanning electron microscope (SEM) (Hitachi, model S-4800, Japan).
3. Results and Discussions
The Pt/Ni NWAs electrode was fabricated by pulse-electrodeposition of Pt and Ni into the pores of a polycarbonate membrane and subsequent chemical etching of the template. There were two methods utilized for fabricating these nanowires arrays in which the deposition time of each pulse had been changed.
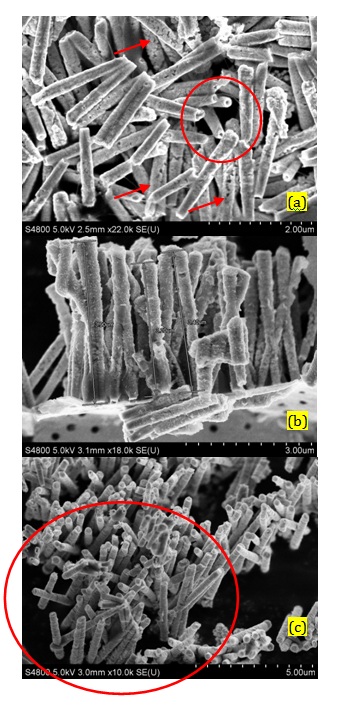
In the first method which was called short-step pulse deposition, the steps had been considered as -0.35 V vs SCE, 40 milliseconds (ms) and -1.5 V vs. SCE, 10 ms. The SEM image in Figure 1a showed the Pt/Ni NWAs fabricated by short-step pulse method. The structure of nanowires was fragile (as indicated by arrows) since the potential deviation during pulse deposition was too fast. According to the diffusion controlled deposition of ions inside the pores (Scharifiker and Mostany, 1984; Mahshid et al., 2010), the duration time of each pulse was too short for the metallic ions to migrate inside the pores and reach the deposition surface at the bottom of the pores. In addition, due to the higher rate of deposition than diffusion rate of ions inside the pores, the deposition of ions preferentially took place along the wall of the pores and a depleted zone was created in the middle of the pores resulting in fabrication of nanotubes instead of nanowires (showing by circle). However, regarding the creation of fragile structure under this deposition condition, the nanotubes were not able to stand beside each other on the substrate and act as individual electrode. As it was obviously shown in Figure 1a, the nanotubes were broken after chemical etching the template and gathered upon each other because of lots of structural effect along the tubes. In this regard, the long-step pulse method was designed in a way that enough time has been considered for diffusion of metallic ions.
The SEM images in Figures 1b and 1c represented the Pt/Ni nanowires arrays (NWAs) which had been created by (-0.35 V vs. SCE, 5 s and -1.5 V vs. SCE, 1 s) long-step pulse method and revealed that uniform Pt/Ni NWAs were fabricated with a length of 4 μm and an average diameter of 200 nm. As indicated in Figure 1b the length of the nanowires were similar corresponding to a diffusion control deposition process (Scharifiker and Mostany, 1984; Mahshid et al., 2010). This would result in a formation of a uniform surface catalyst with high active surface area. It is due to the fact that reagents reached the surface of wires at the same time and each nanowire acted individually as catalyst. In addition, periodic potential changes in deposition process resulted in formation of ordered structures of Pt and Ni respectively. Figure 1c represent well distribution of nanowires beside each other (in the area shown by circle) preparing a suitable surface for catalyst. It is worth noting that the empty area beside the circle is due to the preparation method for SEM imaging which has disordered the well distribution of nanowires in some areas.
3. 1. Cyclic Voltammetry Studies
The oxidation of glucose is pH-dependent and the electrode shows different electrocatalytic activities towards glucose oxidation in media with different acidities. Figure 2 shows the cyclic voltammetries (CVs) obtained at the Pt/Ni NWAs electrode in 0.1 M pH 7 PBS (phosphate buffer solution) solution containing 10 mM glucose with addition of 0 to 200 mM NaOH. A pair of sharp peaks near 0.5 V vs. SCE were gradually appeared as the concentration of NaOH were increased. In this regard, the amount of 100 mM in Figure 2 curve 12, clearly displayed a pair of well-defined oxidation/reduction peaks for glucose. Increasing the amount of NaOH to more than 100 mM (curve 12) resulted in another rise in current regarding to oxidation of other components in solution and consequently disappearance of the oxidation/reduction peaks of glucose. Therefore, the amount of 100 mM NaOH was chosen as supporting electrolyte.
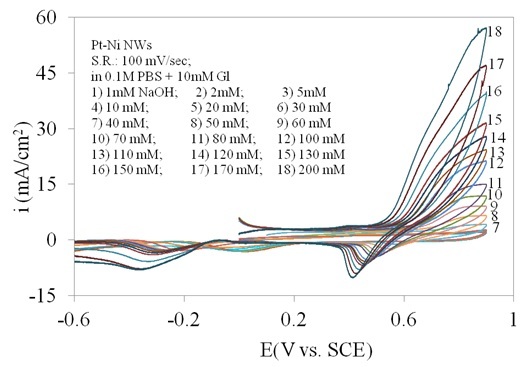
Figure 3 shows the cyclic voltammetry of Pt/Ni NWAs in a wide range of potential scan in the absence and presence of 2 and 4 mM glucose. In order to well understand the role of Pt and Ni in a combined system, two electrodes, Pt NWAs and Ni NWAs were introduced which were prepared in the same condition and electrolyte composition as the Pt/Ni NWAs electrode (Mahshid et al., 2011a). In Figure 3a, the responses of Pt NWAs electrode in alkaline solution in the absence and presence of 10 mM glucose are also shown which were then compared to the Ni NWAs electrode response. While there was no sharp peak on the oxidation branch in the voltammetry response of Pt NWAs in the absence of glucose (curve 4), addition of quite large amount of glucose (10 mM; curve 5) resulted in a rise in the whole curve with still no peak appeared. This is while the response of Ni NWAs electrode showed a pair of well defined peaks at specific area in positive potential range without any other rise in the whole cyclic voltammetry curve in wide range of potential scan. According to the literature (Basu and Basu, 2011), there were some reactions taking place on the surface of Pt catalyst in alkaline media in different potential regions which after addition of glucose caused three different types of glucose oxidation on the surface of Pt catalyst. This fact resulted in not only the presence of different oxidation reduction region in the response curve of Pt NWAs (curve 4), but also the whole rise causing from glucose addition in curve 5 in compared to curve 4.
It was obviously seen that the three sharp oxidation peaks at 0.5 V vs. SEC rising upward with addition of glucose (curves 1, 2, 3) was attributed to the sensitive response of the Pt/Ni NWAs electrode. Since the response of Ni NWAs electrode (curve 6) in alkaline solution was a pair of sharp peaks at 0.5 mV/sec, it was concluded that combination of Pt and Ni resulted in more conductive electrode with higher sensitivity toward glucose concentration changes (Mahshid et al., 2011a). There was also a sharp reduction peak for glucose at -0.1 V vs. SCE in Pt/Ni NWAs which probably was attributed to reduction of the metallic oxides and in comparison to curve 4 and 5 it was shifted positively since the Pt-Ni oxide in Pt/Ni NWAs had more desire for reduction than Pt alone in Pt NWAs.
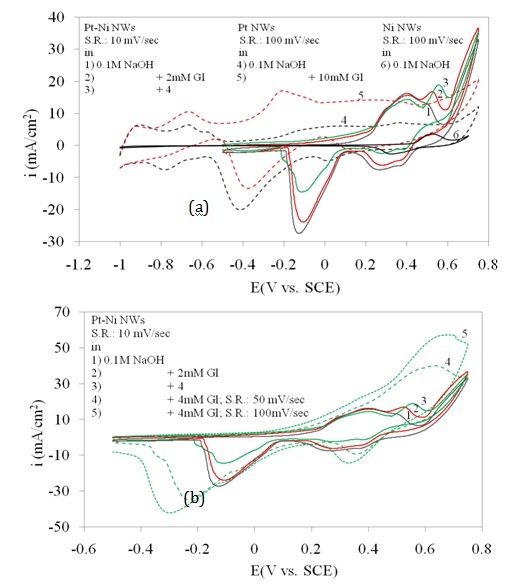
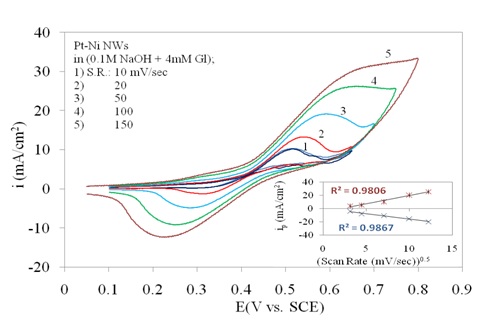
In Figure 3b the three curves of 1, 2 and 3 for Pt/Ni NWAs response is also repeated. However the effect of scan rate is shown by increasing the scan rate in presence of 4 mM glucose (curves 4 and 5). It was obviously seen that increasing scan rate resulted in increase in peak current and also peak potential which was a typical behaviour for diffusion peaks. In this regard, three obvious oxidation and reduction peaks on Pt/Ni NWAs electrode were detected which were assigned for glucose oxidation or reduction on this electrode since the increasing of scan rate had a diffusion-controlled affect on these peaks. It is worth noting that these oxidation and reduction peaks were attributed to a diffusion-controlled surface reaction as they were dependently changing with scan rates (Mahshid et al., 2011a).
Figure 4 shows the cyclic voltammetry of Pt/Ni NWAs electrode in the absence and presence of glucose representing the electrocatalytic activity of the electrode in a wide range of glucose concentration. In the absence of glucose (curve 1), a pair of sharp redox peaks on the electrode surface was observed which were mainly assigned to the Ni+2/Ni+3 redox couple in the alkaline medium (Wilson and Gifford, 2005). By addition of glucose (curve 2 to 11), a great enhancement in anodic peak current appeared while the cathodic peak current gradually decreased. It was due to the fact that the Pt/Ni NWAs electrode catalyzed the oxidation of glucose in the exchanging reactions with NiO/Ni(OH)2 and NiO(OH) in alkaline media (Safavi et al., 2009; Lu et al., 2009). In this regard, the NiO or Ni(OH)2 species were produced due to the oxidation of Ni to Ni2+ ions at more negative potentials (Lu et al., 2009; Mahshid et al., (2011a, b)). On the other hand, the impact of Pt in alloyed structure with Ni resulted in more catalytic activity of the electrode since the Pt faced geometrical and electrical modifications in alloyed structure. According to the literature (Min et al., 2000; Park et al., 2002) this phenomenon came from (1) the reduced Pt–Pt neighboring distance as the catalysts were alloyed, and also (2) the Pt4f binding energies for the Pt/Ni alloy were lower than those for Pt. As a result, more catalytic activity of Pt/Ni NWAs toward glucose oxidation was expected than Pt or Ni-alone nanowires. This will be more clearly shown in Figure 6.
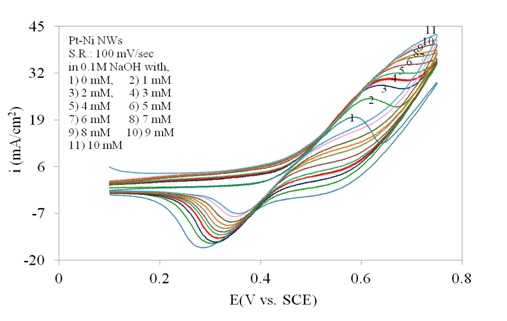
The peak current increased and the electrode still had current response in the high concentration of glucose (higher than 4 mM glucose) in Figure 4. Accordingly, the result indicated that the sensing ability of the proposed electrode in more concentrated solution of glucose was still large enough to be counted. However, it was obviously seen that at glucose concentration higher than 8 mM the response of the electrode gradually reduced indicating the decrease in sensing ability of the electrode. In this regard a linear range up to 8 mM glucose addition was expected from the proposed electrode (as will be shown in Figure 8).
In Figure 5 the dependent behaviour of oxidation/reduction peaks of glucose to scan rate has been confirmed by sketching the plot of peak current versus square root of scan rate. The linear behaviour on both anodic and cathodic branches in this plot represented the diffusion controlled reactions on electrode surface.
The effect of Pt on Ni as the main catalysis reagent in this electrode is shown in Figure 6.
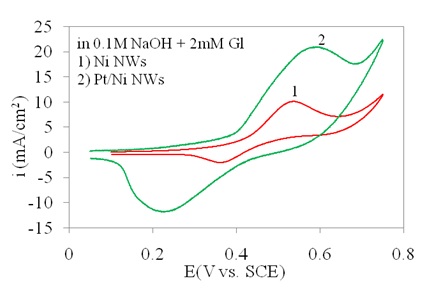
It was indicated that the presence of Pt resulted in current increase in the redox process. The major reason would be the Pt-induced higher conductivity as compared to the Ni NWAs. In Pt/Ni NWAs electrode, although Ni was oxidized to NiO or Ni(OH)2, during the redox process the conductivity of the electrode remained high as the Pt would not be oxidized and were dispersed all along the nanowire structures. Consequently, the amount of current respond remained high on this electrode due to the co-existence of Pt and Ni as separated nano-layers with high conductivity and catalytic activity (Mahshid et al., (2011a, b)).
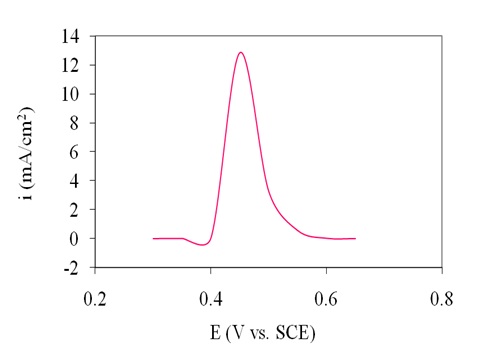
The impact of applied potential on the amperometric response of the electrode was investigated through a series of constant potential chronoamperometry. The results in Figure 7 indicated that by varying the potential (in 0.05 V steps) of the electrode between 0.3 and 0.65V vs. SCE in the presence of 4 mM glucose, the steady-state current gradually increased until it reached the maximum at 0.45 V vs. SCE, then decreased at more negative potential than 0.45 V vs SCE. Therefore, 0.45 V vs. SCE was identified as the applied potential for amperometric detection of glucose.
3. 2. Amperometric Detection of Glucose
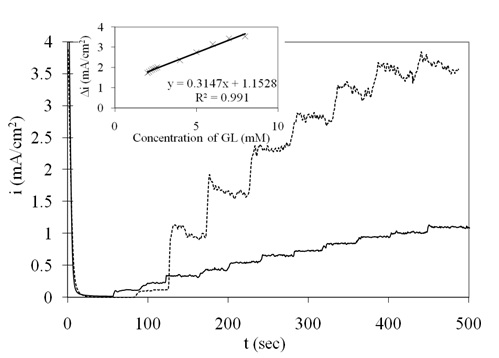
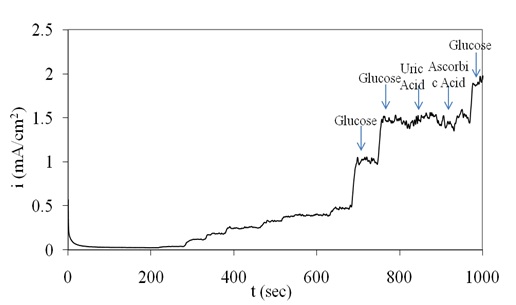
The amperometric current response of the Pt/Ni NWAs electrode upon successive additions of 0.1 mM (curve 1) and 1 mM (curve 2) glucose at potential of 0.45 V vs. SCE is illustrated in Figure 8. The oxidation reaction occurred very fast and the current reached its steady state region within almost 3 s. The calibration plot for glucose determination was previously reported in the linear range of 2 μM to 2 mM glucose concentration with sensitivity of 920 μAmM−1 cm−2 (Mahshid et al., 2011a). However, cyclic voltammetry shown in Figure 4 revealed that the Pt/Ni NWAs electrode had sensing ability in wider range up to 8 mM glucose addition. Accordingly, in this work, a wide linear range from 2 mM to 8 mM (inset of Figure 8) with a sensitivity of 315 μAmM−1 cm−2 (R = 0.991) was calculated and reported. The LOD of the proposed electrode was obtained as 1.5 μM.
The amperometric response of the proposed electrode toward detection of glucose interferences was tested by addition of significant amount of uric acid and ascorbic acid in the presence of glucose. In this regard, the response of the electrode to 1 mM glucose addition in the absence and presence of 0.1 mM uric acid and 0.1 mM ascorbic acid was reported. Figure 6 indicates that uric acid and ascorbic acid at this level have no significant interference to the detection of glucose at 0.45V vs. SCE in 0.1M NaOH solution.
4. Conclusion
In this work, the catalytic activity of the Pt/Ni NWAs electrode towards glucose oxidation was investigated in the wide range of glucose concentration. The modified electrode was fabricated by pulse electrodeposition method. The procedure had been designed in a way that the competition between deposition rate and diffusion rate inside the pores in the diffusion controlled deposition of metallic ions resulted in the uniform structure of wires with the same length arranged as well distributed arrays of nanowires. The effect of alkaline solution on the response of electrode was first studied. The Pt/Ni NWAs electrode represented high electrocatalytic activity towards oxidation of glucose in alkaline solution due to the improved catalytic activity and conductivity of Ni and Pt in combined system. It is due to the fact that both Pt and Ni as single-metal nanowire arrays electrodes has good response in alkaline media toward glucose while the conductivity of the electrode made by combination of these two metals is higher than the individuals. The resultant electrode displayed good catalytic activity towards oxidation of glucose in a wide range of 2 mM to 8 mM with linear response and LOD of 1.5 μM. Furthermore, ascorbic acid and uric acid show no significant interference in glucose detection.
Acknowledgements
Funding for this work by the program for Changjiang Scholars and Innovative Research Team in University (PCSIRT), National Basic Research Program of China under Grants No. 2009CB421601, and the National Science Fund for Distinguished Young Scholars under grant No. 50725825 is gratefully acknowledged.
References
Basu, D., Basu, S. (2011). Synthesis and characterization of Pt-Au/C catalyst for glucose electro-oxidation for the application in direct glucose fuel cell. Electrochimica Acta, 56, 6106-6113. View Article
Chu, X., Duan, D., Shen, G., Yu, R. (2007). Amperometric glucose biosensor based on electrodeposition of platinum nanoparticles onto covalently immobilized carbon nanotube electrode. Talanta, 71, 2040. View Article
Honda, S., Taga, A., Kotani, M., Grover, E.R. (1997). Separation of aldose enantiomers by capillary electrophoresis in the presence of optically active N-dodecoxycarbonylvalines. Journal of Chromatography A, 792, 385. View Article
Lima, F. H. B., de Castro, J.F.R, Ticianelli, E. A. (2006). Structural Characterization of Pt-Co/C alloys prepared by borohydride and impregnation method for oxygen reduction in alkaline solution. Brazilian Synchrotron Light Laboratory, Activity Report, 1-2. View Article
Lu, L.M., Zhang, L., Qu, F.-L., Lu, H.-X., Zhang, X.-B., Wu, Z.-S., Huan, S.-Y., Wang, Q.-A., Shen, G.-L., Yu, R.-Q. (2009). A nano-Ni based ultrasensitive nonenzymatic electrochemical sensor for glucose: Enhancing sensitivity through a nanowire array strategy. Biosensors & bioelectronics, 25, 218. View Article
Mahshid, S.S., Dolati, A., Hashemi Daryan, S., Ghorbani, M., Ghahramaninezhad, A. (2010). Electrodeposition of Platinum Nanowires: Electrochemical Characterization. ECS Transactions, 28, 25. View Article
Mahshid, S.S., Mahshid, S., Dolati, A., Ghorbani, M., Yang, L., Luo, S., Cai, Q. (2011a). Template-based electrodeposition of Pt/Ni nanowires and its catalytic activity towards glucose oxidation. Electrochimica Acta, 58, 551– 555. View Article
Mahshid, S.S., Luo, S., Yang, L., Mahshid, S., Dolati, A., Ghorbani, M., Cai, Q. (2011b). A well-dispersed Pt/Ni/TiO2 nanotubes modified electrode as an amperometric non-enzymatic glucose biosensor. Sensor letters, 9, 1598-1605. View Article
Min, M. -K, , Cho, J., Cho, K., Kim, H. (2000). Particle size and alloying effects of Pt-based alloy catalysts for fuel cell applications. Electrochimica Acta, 45, 4211–4217. View Article
Musameh, M.M., Torabi Kachoosangi, R., Xiao, L., Russell, A., Compton R.G. (2008). Ionic liquid-carbon composite glucose biosensor. Biosensors & bioelectronics, 24, 87. View Article
Newman, J.D., Turner, A.P.F. (2005). Home blood glucose biosensors: a commercial perspective. Biosensors & bioelectronics, 20, 2435. View Article
Park, K.-W., Choi, J.-H., Kwon, B.-K., Lee, S.-A., Sung, Y.-E. Ha, H.-Y., Hong, S.-A., Kim, H., Wieckowski, A. (2002). Chemical and Electronic Effects of Ni in Pt/Ni and Pt/Ru/Ni Alloy Nanoparticles in Methanol Electrooxidation. Journal of Physical Chemistry B, 106, 1869-1877. View Article
Qu, F.-L., Yang, M., Jiang, J., Feng, K., Shen, G.-L., Yu, R.-Q. (2007). Novel poly (neutral red) nanowires as a sensitive electrochemical biosensing platform for hydrogen peroxide determination. Electrochemistry Communications, 9, 2596. View Article
Safavi, A., Maleki, N., Farjami, E. (2009). Fabrication of a glucose sensor based on a novel nanocomposite electrode. Biosensors & bioelectronics, 24, 1655. View Article
Scharifiker, B.R., Mostany, J. (1984). Three-dimensional nucleation with diffusion controlled growth: Part I. Number density of active sites and nucleation rates per site. Journal of Electroanalytical Chemistry and Interfacial Electrochemistry, 177, 13. View Article
Shervedani, R.K., Mehrjardi, A.H., Zamiri, N. (2006). A novel method for glucose determination based on electrochemical impedance spectroscopy using glucose oxidaseself-assembled biosensor. Bioelectrochemistry, 69, 201. View Article
Turner, A.P., Chen, B., Piletsky, S. (1999). In vitro diagnostics in diabetes: Meeting the challenge. Clinical Chemistry, 45, 1596. View Article
Wilson, G.S., Gifford, R. (2005). Biosensors for real-time in vivo measurements. Biosensors & bioelectronics, 20, 2388. View Article
Zhang, N., Wilkop, T., Lee, S., Cheng, Q. (2007). Bi-Functionalization of a. Patterned Prussian Blue Array for Dual-Potential Amperometric Detection of Glucose. Analyst, 132, 164. View Article